Category Archives: VLE platforms

The many flavours of SCORM

This post documents my investigation into getting SCORM packaged content to play in Blackboard and looking at what we can learn about the learner’s interactions via the Grade Centre.

There is often a need for a simple way to insert learning materials created outside the LMS (Blackboard, Moodle, Sakai, etc.) into it. These could be materials produced by a third party – perhaps supporting a published text book, or a custom training course. It is at this point that people usually start talking about SCORM.

What is SCORM?

SCORM (the Sharable Content Object Reference Model) although not a standard (sensu IMS, etc.) is the nearest thing there is to one. Whilst newer formats such as Tin Can (also called the Experience API) offer more possibilities, at the time of writing very few LMS vendors have implemented these sufficiently to make them any more functional than the latest flavours of SCORM. The list of Tin Can adopters published by Rustici is impressive, but may perhaps be best seen at present as a list of those working to implement it fully (see for example these posts regarding Sakai, Blackboard and Moodle). Apologies in advance if there are more recent developments that I am not aware of!

The trouble with SCORM is that it is not a single thing. In fact it is a wrapper around a series of existing formats, and you can meet this reference model in several different ways. Most people using SCORM today use one of these “flavours”:

  1. SCORM 1.2
  2. SCORM 2004 – which is available in 4 editions, edition 4 (2009) being the latest.

Rustici have published a very useful set of SCORM resources. In this post I am going to test some custom content created in Adobe Captivate and export it using a range of SCORM flavours, importing the resulting file into Blackboard. I will then look at the reporting options available and how these measure up to those for a standard test/quiz. Technical Information

  • Adobe Captivate 8.0.2.266 running on a MacBook Pro with OS X Yosemite
  • Blackboard Learn 9.1 October 2014 release (CU2)
  • Building Block: Rustici SCORM Engine 2013.4.1164954*

* Blackboard released a new version of this Building Block as I was part way through these tests. I have learnt the hard way not to apply these too quickly.

The Content

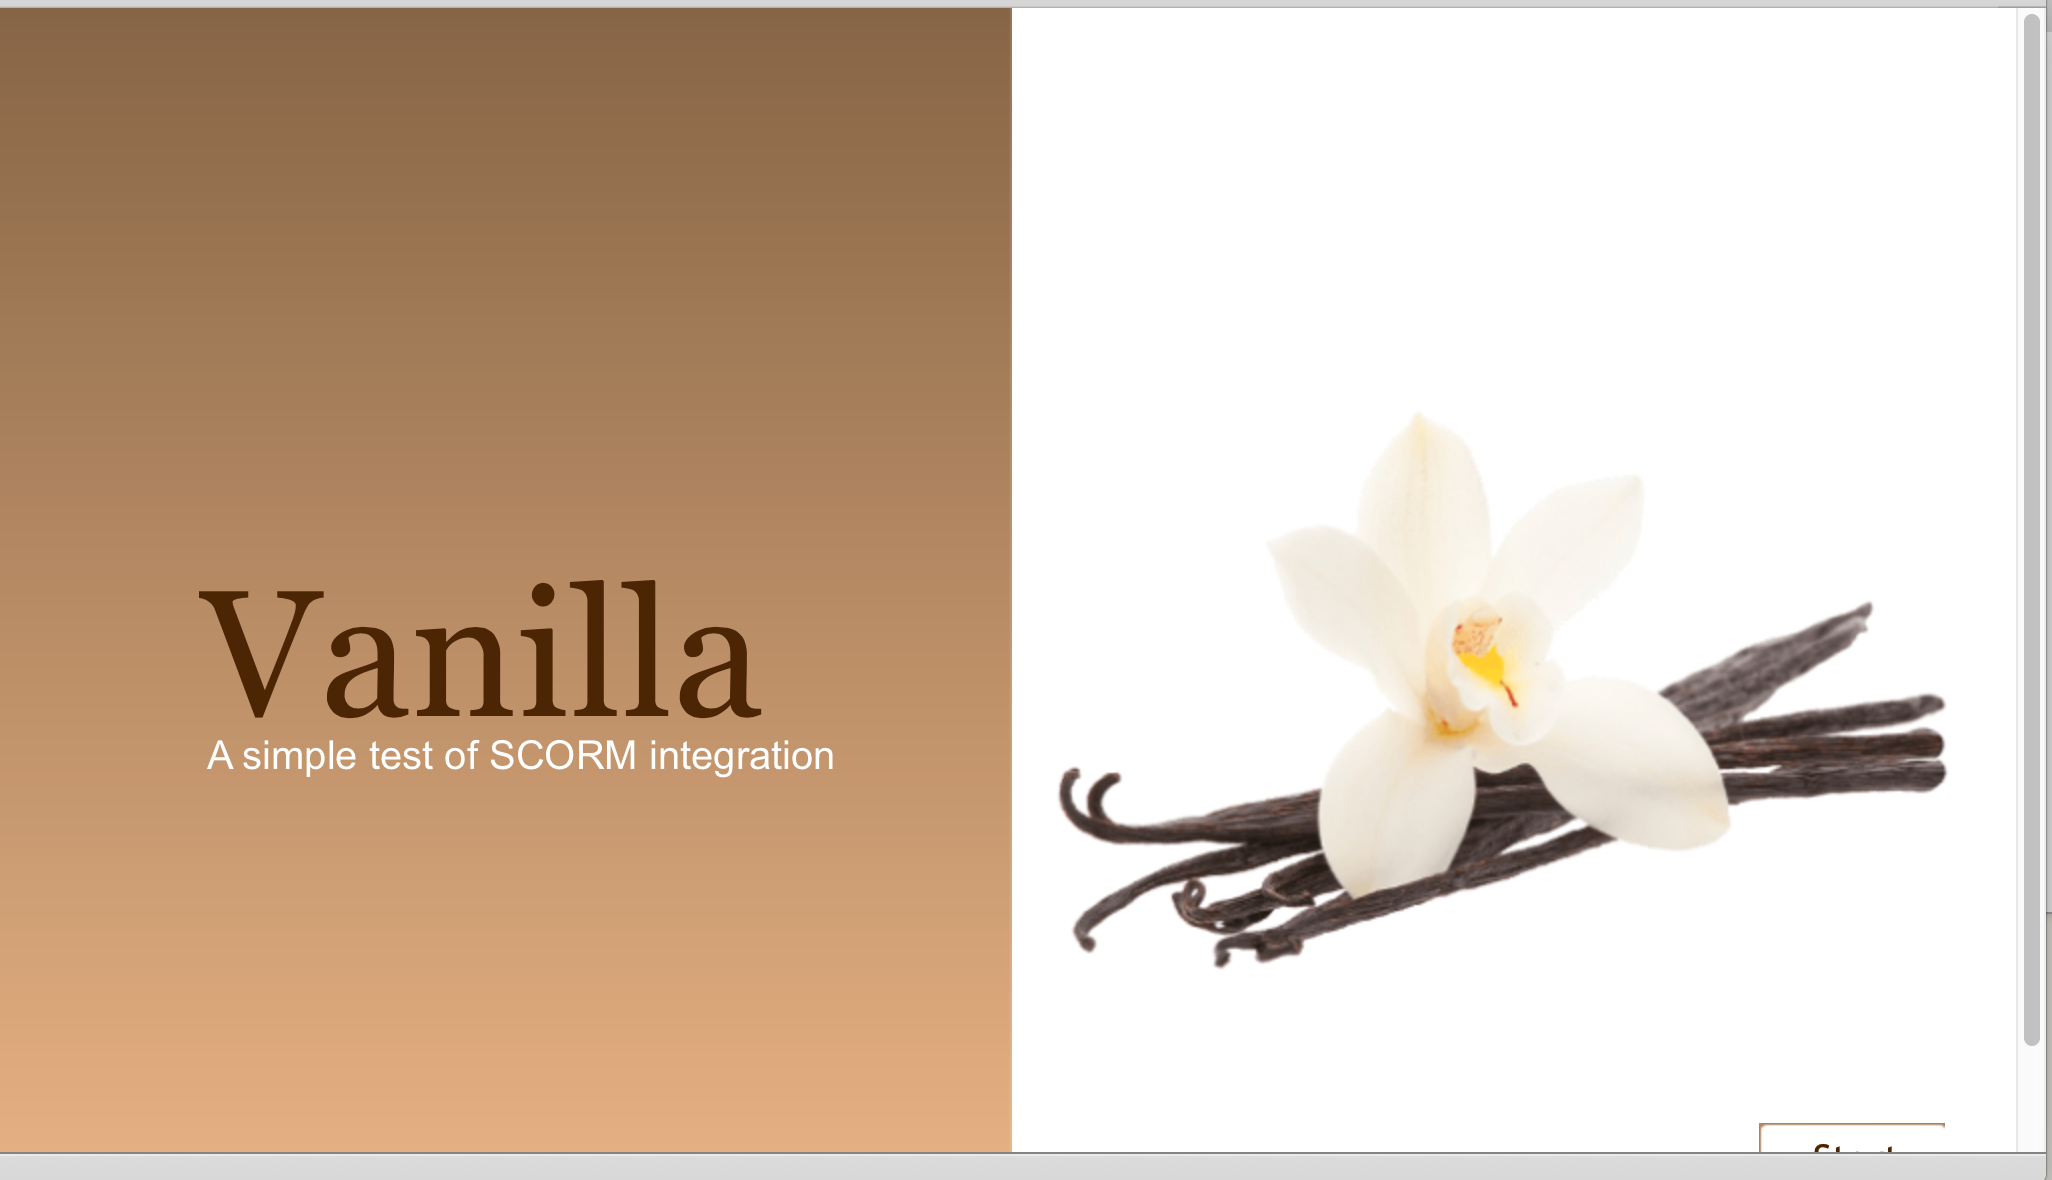
I created a simple object (which I called Vanilla) which uses a range of different question types. Some of these are drawn from pools, some are hard-coded into the object. In any run through, the user will be asked to answer eight questions, each worth 10 points:

  1. Multi-choice (single answer) question – 1 drawn at random from a pool of three questions
  2. True/False question
  3. Fill in the blanks question
  4. Matching question (three heads to three tails)
  5. Image hotspot question
  6. Ordering question (arrange the 7 steps of a process in the correct order)
  7. Multi-choice (single answer) question – 1 drawn at random from a pool of three questions
  8. As 7, with a different question drawn from the same pool.
Creating the Quiz in Captivate

Scoring Options

Before exporting anything, you need to define how a person passes the test. This is defined in the project Preferences. File | Project Info and then click on the Pass or Fail option down the LHS:

Scoring Options
Scoring Options

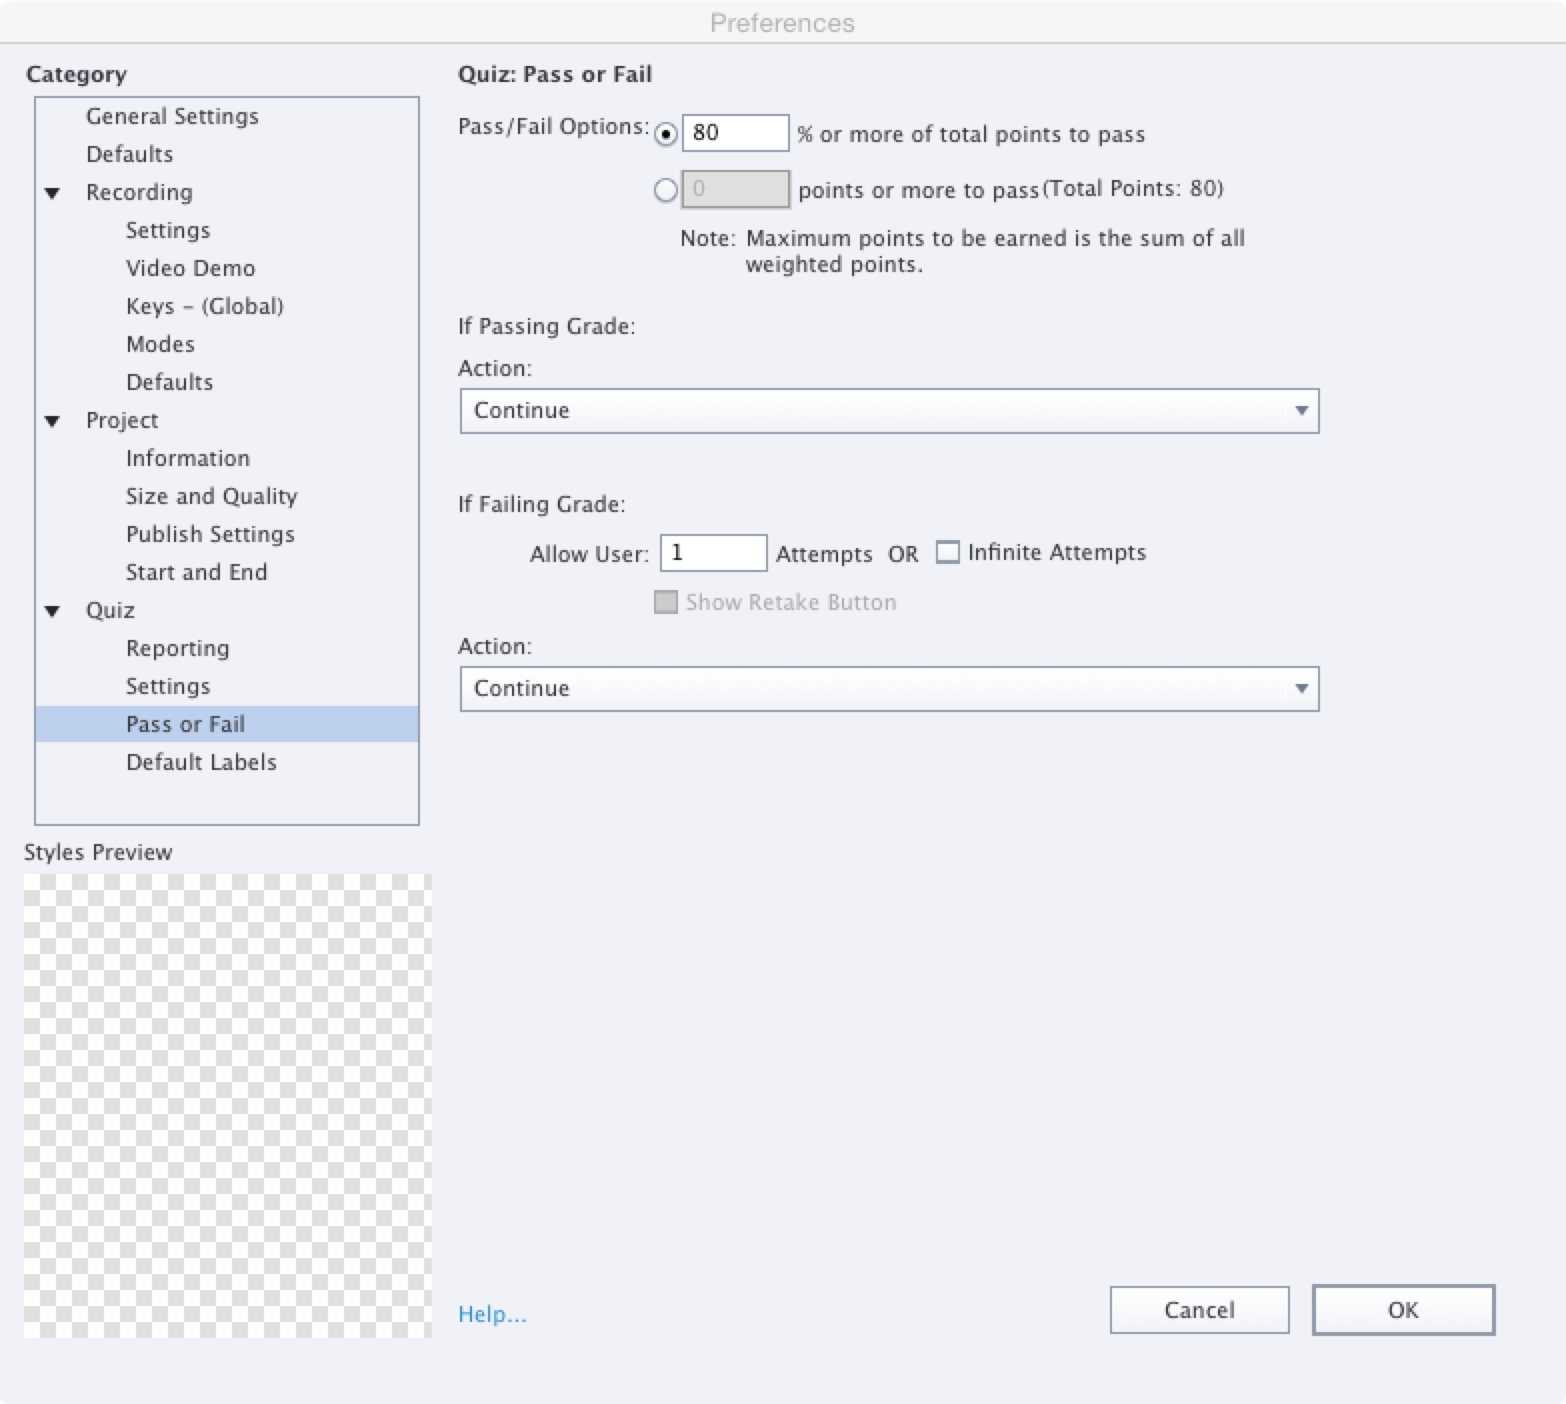
You can see here that we have set the pass rate to be 80% (pretty high). There is also the option to choose a numerical score as the threshold. The other options (relating to what happens if you fail and the ability to retake the quiz can be ignored for the purposes of this test). The next step – deciding what to report back differs depending on the SCORM flavour you use…

Export Options

A SCORM object can report (to the LMS, usually via the Grade Centre or equivalent) different measures, depending both on the SCORM flavour you use and the way you set it up. Typical fields it can report are:

  • The Completion status (how many of the pages of content you actually viewed). When a SCORM course is launched, the status changes to Incomplete. It changes to Complete when the user meets certain criteria – the Completion Criteria.
  • The Score of any quizzes taken
  • The score and/or the completion status can also be used to derive a Pass/Fail flag
  • Ideally, you also want it to provide details of the Interaction – how long people spent on each page, which questions they attempted (remember these may be drawn at random from a poll) and the answers they provided.

In the simplest case, the Completion Criteria might be just that the user has launched the package. It is more commonly defined as either viewing a certain number/percentage of slides and/or achieving a pass score in the quiz. In order to export content as SCORM you need to adjust the project Preferences. File | Project Info and then click on the Reporting option down the LHS:

SCORM 1.2

If you select SCORM 1.2 under the Standard select control the rest of the page looks like this:

Configured as per suggestions
SCORM 1.2 settings Configured as per suggestions

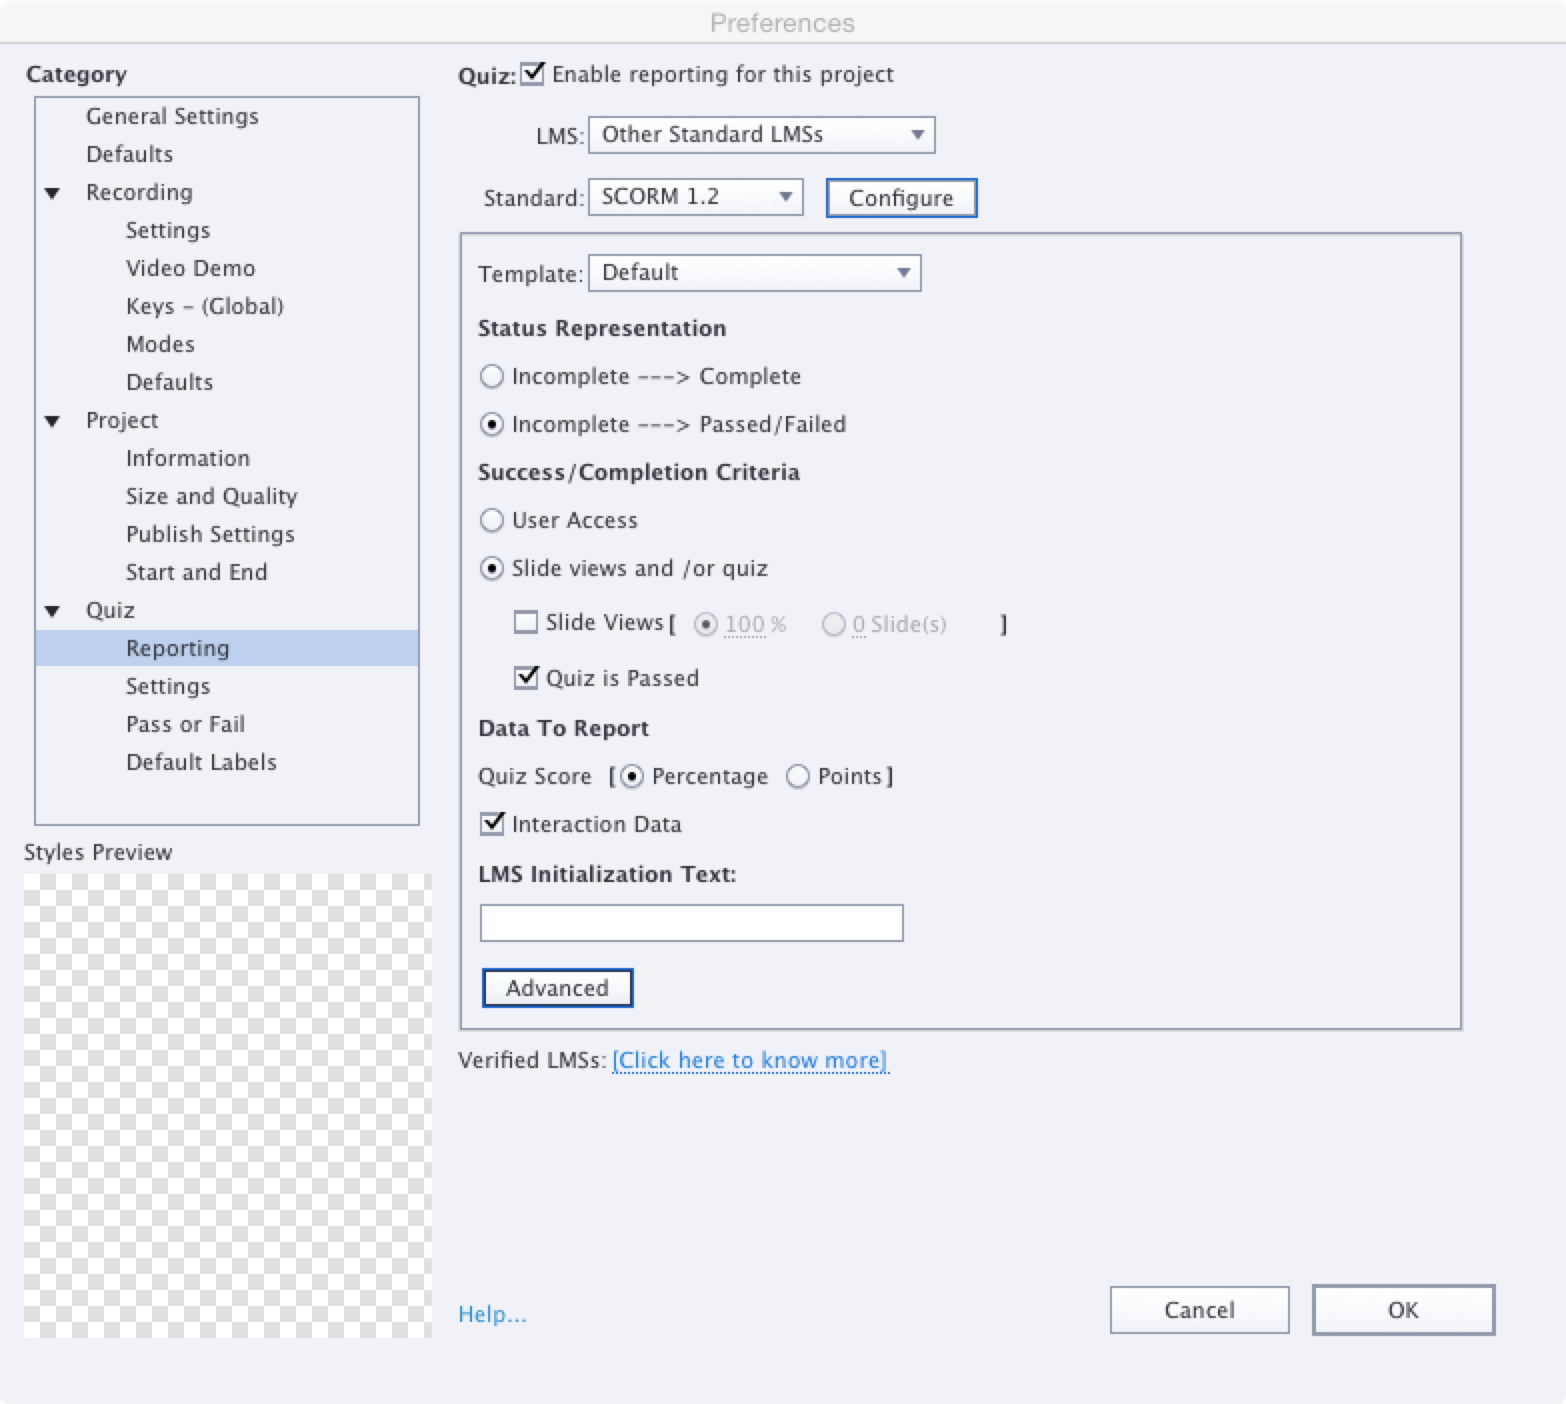
You can see that you can choose to simply report that a user’s interaction with the object is complete or incomplete, or go for the slightly more nuanced incomplete/fail/pass. In the second step – Success/Completion Criteria you can define whether you want to define a Pass in terms of User Access (either simply a percentage of slides viewed and/or passing the quiz). If you click the Configure button, you can see the values that will be written into the SCORM manifest file (these values are used when you deploy the content into the LMS):

configure scorm1.2 
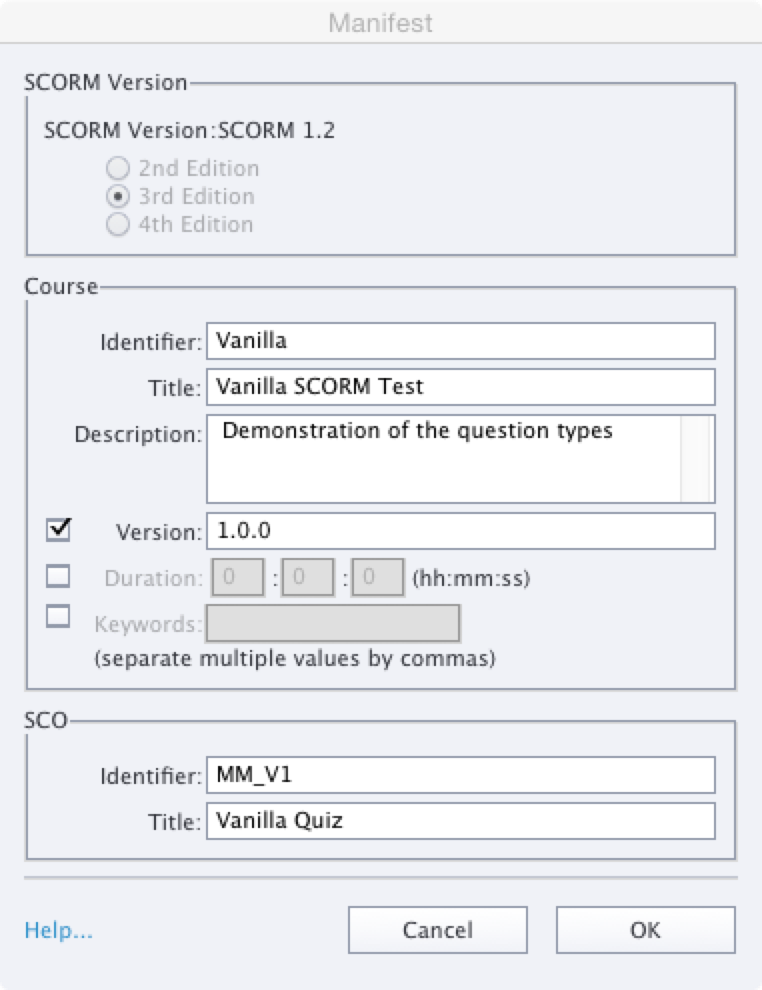
Note that you only have the option to export the 3rd Edition flavour of SCORM 1.2 in Captivate. It also only supports a single SCO (Sharable Content Object) within a project (actually the entire project), even though SCORM itself allows several. This restricts the reporting options, although in most cases a single SCO is adequate. The default Advanced settings are used in these tests:

Advanced settings
If in doubt leave these as they are

SCORM 2004

If we select SCORM 2004 under the Standard, the page changes slightly: prefs 
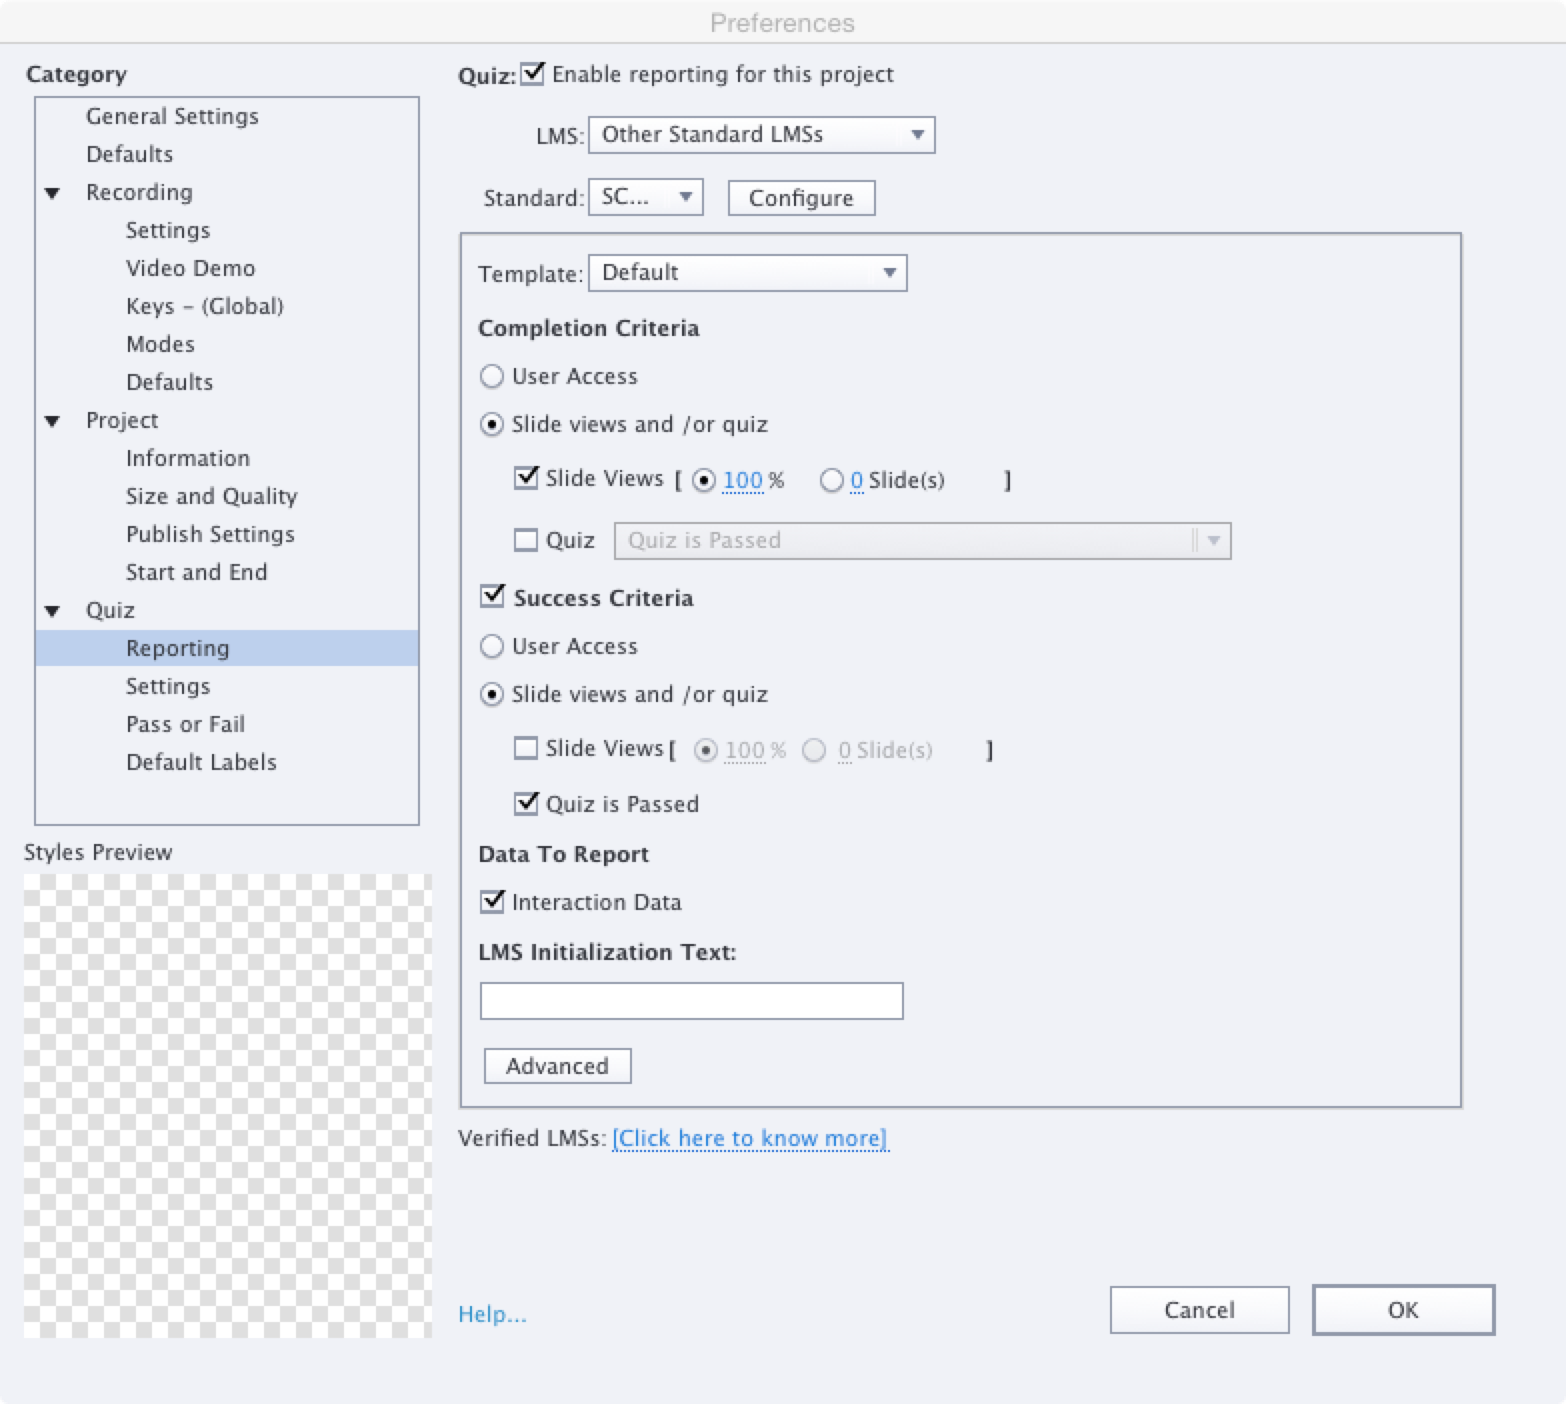
The Status Representation options seen in SCORM 1.2 disappears and instead we have the option to define separate Completion and Success criteria. This allows for the same level of reporting as the earlier incomplete/fail/pass option: incomplete = Completion criteria not met, Success criteria not met; fail = Completion criteria met but Success criteria not met; pass = both Completion and Success criteria met. You can define both criteria using test scores, number of slides viewed or just opening the package. In my case I have opted to define completion as viewing a certain number of slides and success as passing the test. Again there is the option to report the Interaction Data. If you click Configure, the dialogue displayed is similar to SCORM 1.2 but not that the user has the option to select their preferred version of SCORM 2004 – one of the 2nd, 3rd and 4th edition.

configure

I chose to use the latest one. We left the Advanced settings at defaults (as with SCORM 1.2). For testing I published three SCORM 2004 versions, one for each edition available in Adobe Captivate.

Publishing the Content as a Zip File

Regardless of SCORM flavour, the process of publishing the content is the same: File | Publish…

You can see that this file will be deployed as HTML rather than a SWF
You can see that this file will be deployed as HTML rather than a SWF. The chosen SCORM flavour is shown at the bottom right.

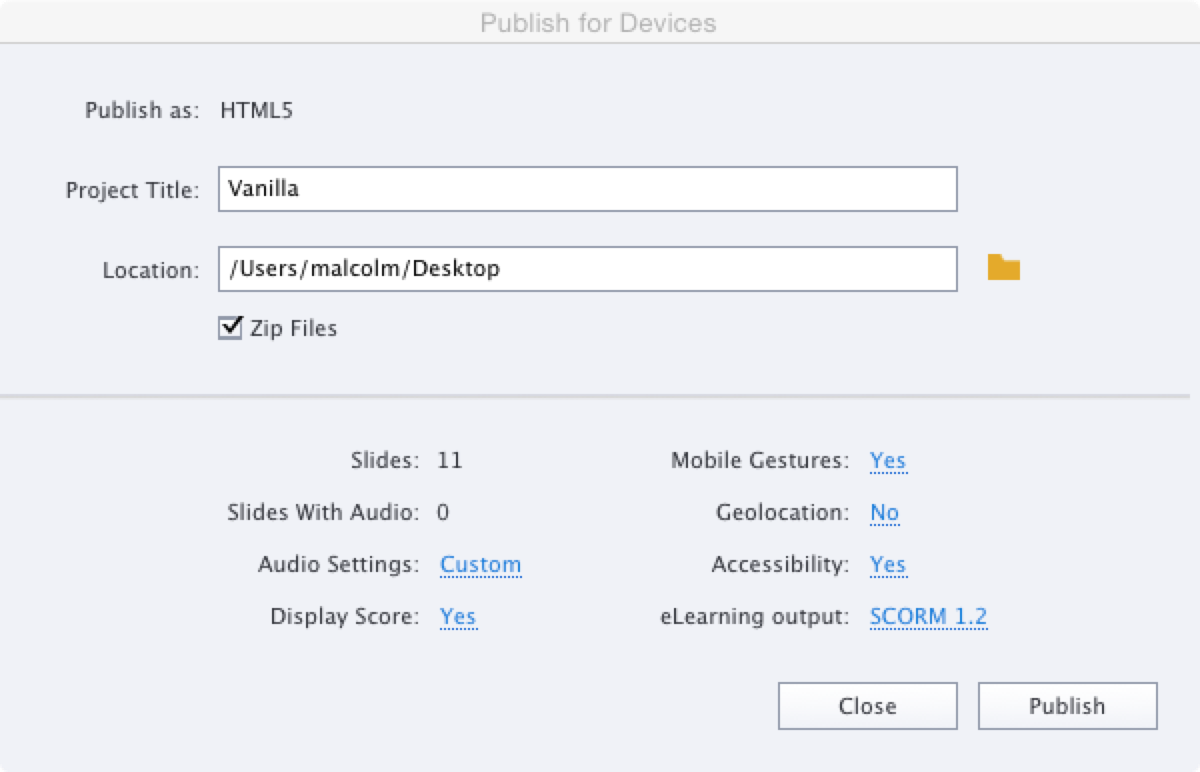
Note that the option to Zip Files is ticked. In summary, at the end of the tests I had four SCORM packages:

  • SCORM 1.2 3rd Edition
  • SCORM 2004 2nd Edition
  • SCORM 2004 3rd Edition
  • SCORM 2004 4th Edition

Deployment Options

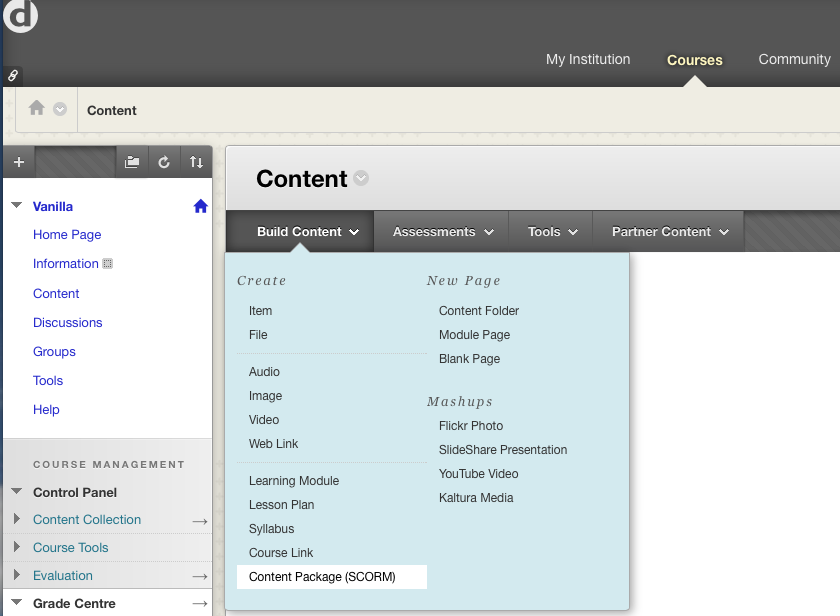
The content was added to a new Blackboard course as a Content Package (SCORM) – this is the custom content type defined by Rustici’s building block:

Adding the SCORM package

You are prompted for the location of the zip file you published:

Click Browse My Computer to locate the ZIP file
Click ‘Browse My Computer’ to locate the ZIP file

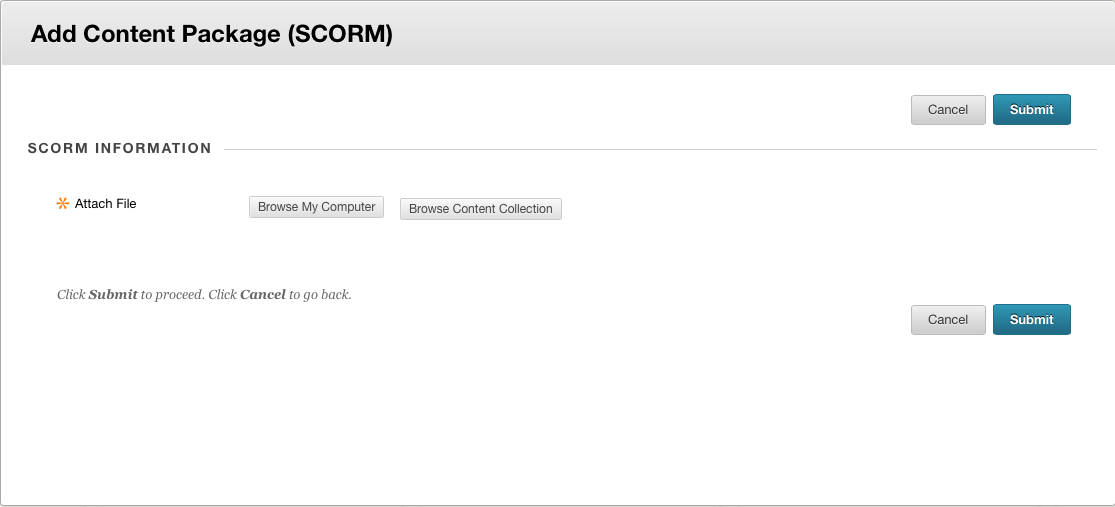
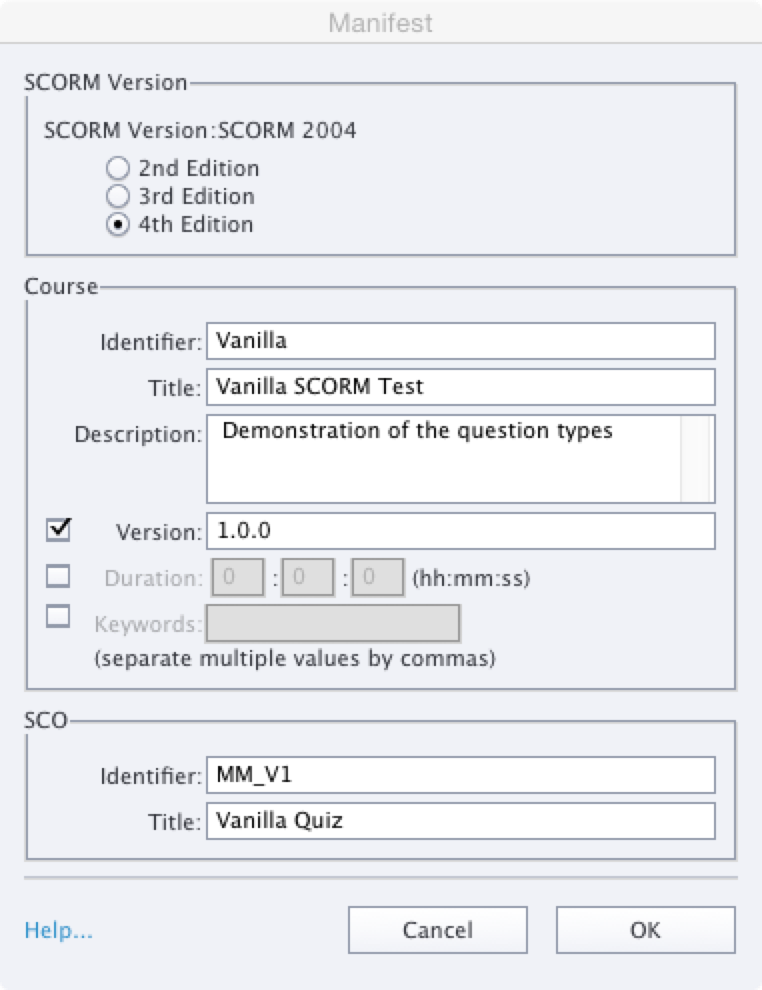
after selecting the file, I clicked Submit to upload it to Blackboard where the manifest file is parsed. The first part of the form reads the descriptors from the manifest and asks you to confirm the details displayed to students: add step1

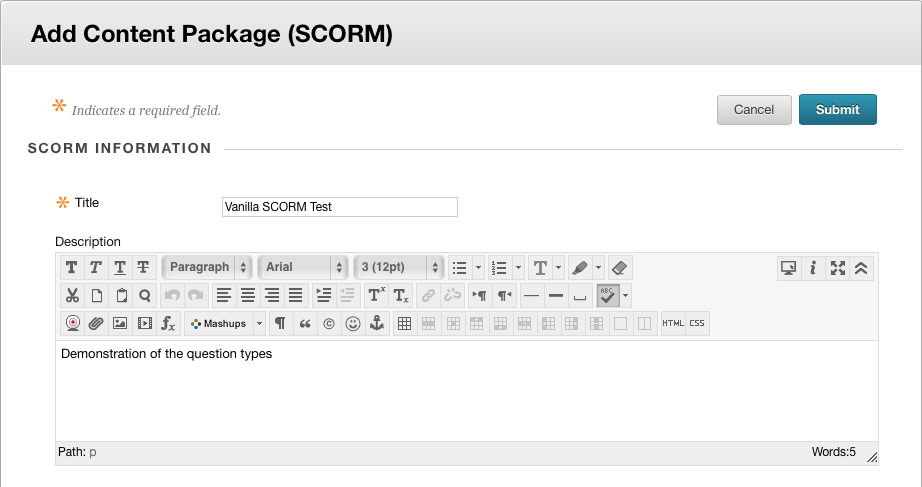
Note the fact that the Title and Description values are taken from the manifest using the values you typed into the Configure box above. The second section determines how users can interact. After thanking the developer for selecting “No” as the default option for Make SCORM Available (can never get enough radio button clicks) then it’s down to the attempts. For these tests I am going to allow an unlimited number, without any date restrictions. There is no sense in turning tracking on as you will get much better data from the SCORM object itself when you open the Grade Centre. add step2

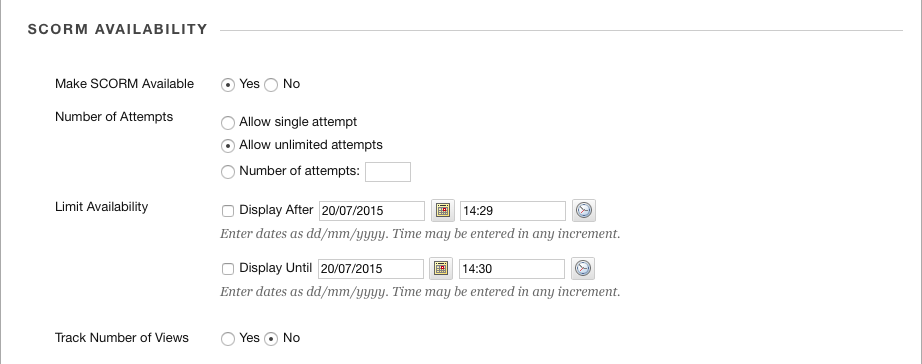
The third section is where you define the integration with the Grade Centre (unless you choose the option No Grading). Note that even if the content doesn’t have a quiz baked into it,  you could set a simple score related to completion that would indicate the people who had worked through it. Blackboard users note, the Title setting here is what is used to name the Grade Centre column. Given the multiple flavours of SCORM that I am testing, I will have to be careful here and use one of these names each time:

  • v1.2
  • v2004e2
  • v2004e3
  • v2004e4

Keeping them short is a vain attempt to reduce the scrolling in the Grade Centre. I’m selecting to use the SCORM Score as the Grade, so I will see how well people have done in the quiz. The Grade SCOS (which should read Grade SCOs) section can be left at No as this captivate content can only ever have one shareable content object, so there is no need to provide separate scores for each part. I am leaving Grade Timing at showing the Grade of Last SCORM Attempt (though you can get them all via the Grade History). Screen Shot 2015-07-20 at 14.31.05

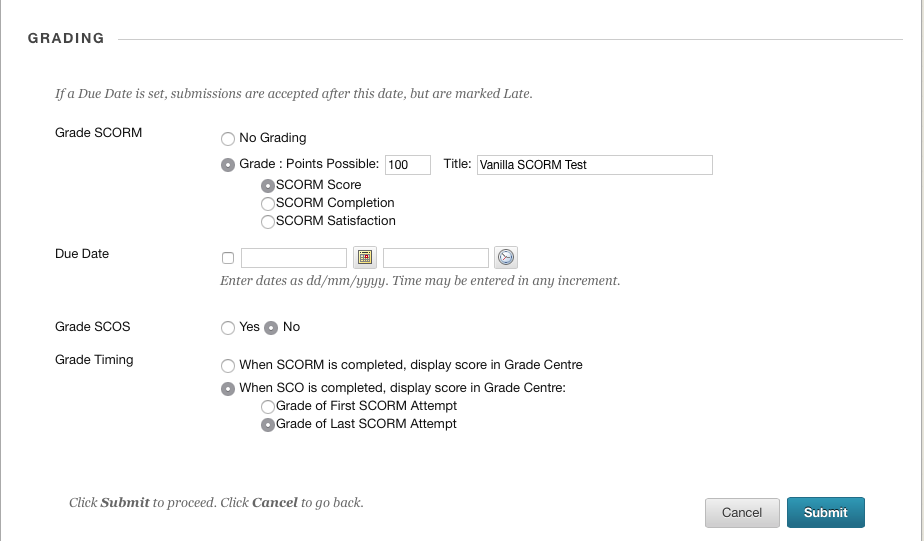
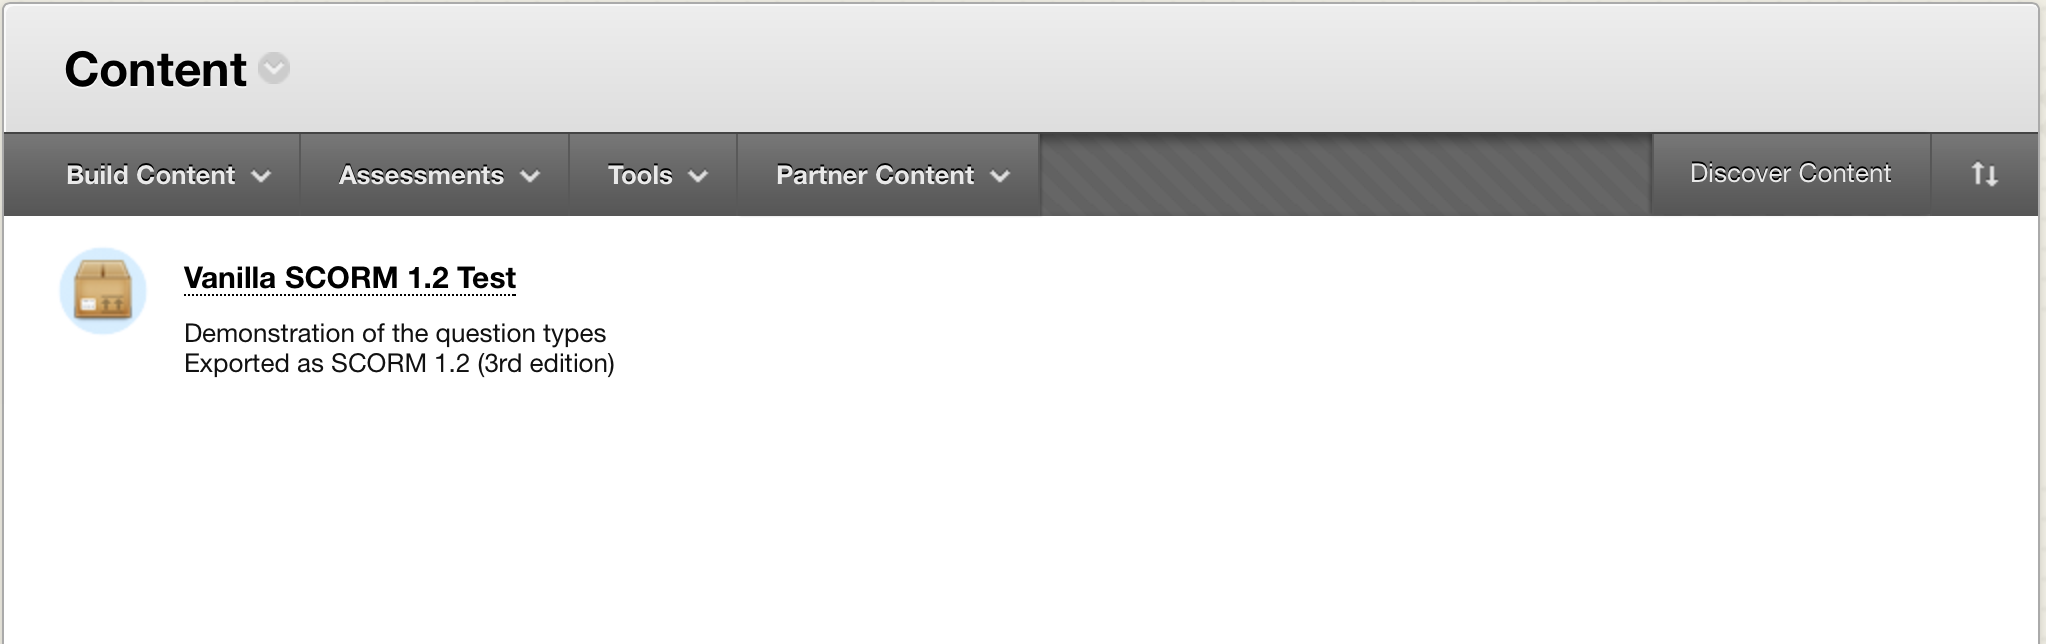
Finally clicking the Submit button creates an entry in Blackboard

Screen Shot 2015-07-21 at 16.28.35

When you click the link, the chances are out the box it will not behave as you wish. In my case, it opens as a new popup window that is not quite the right size:

Opening in a pop-up
Opening in a pop-up – note the scroll bars 😦

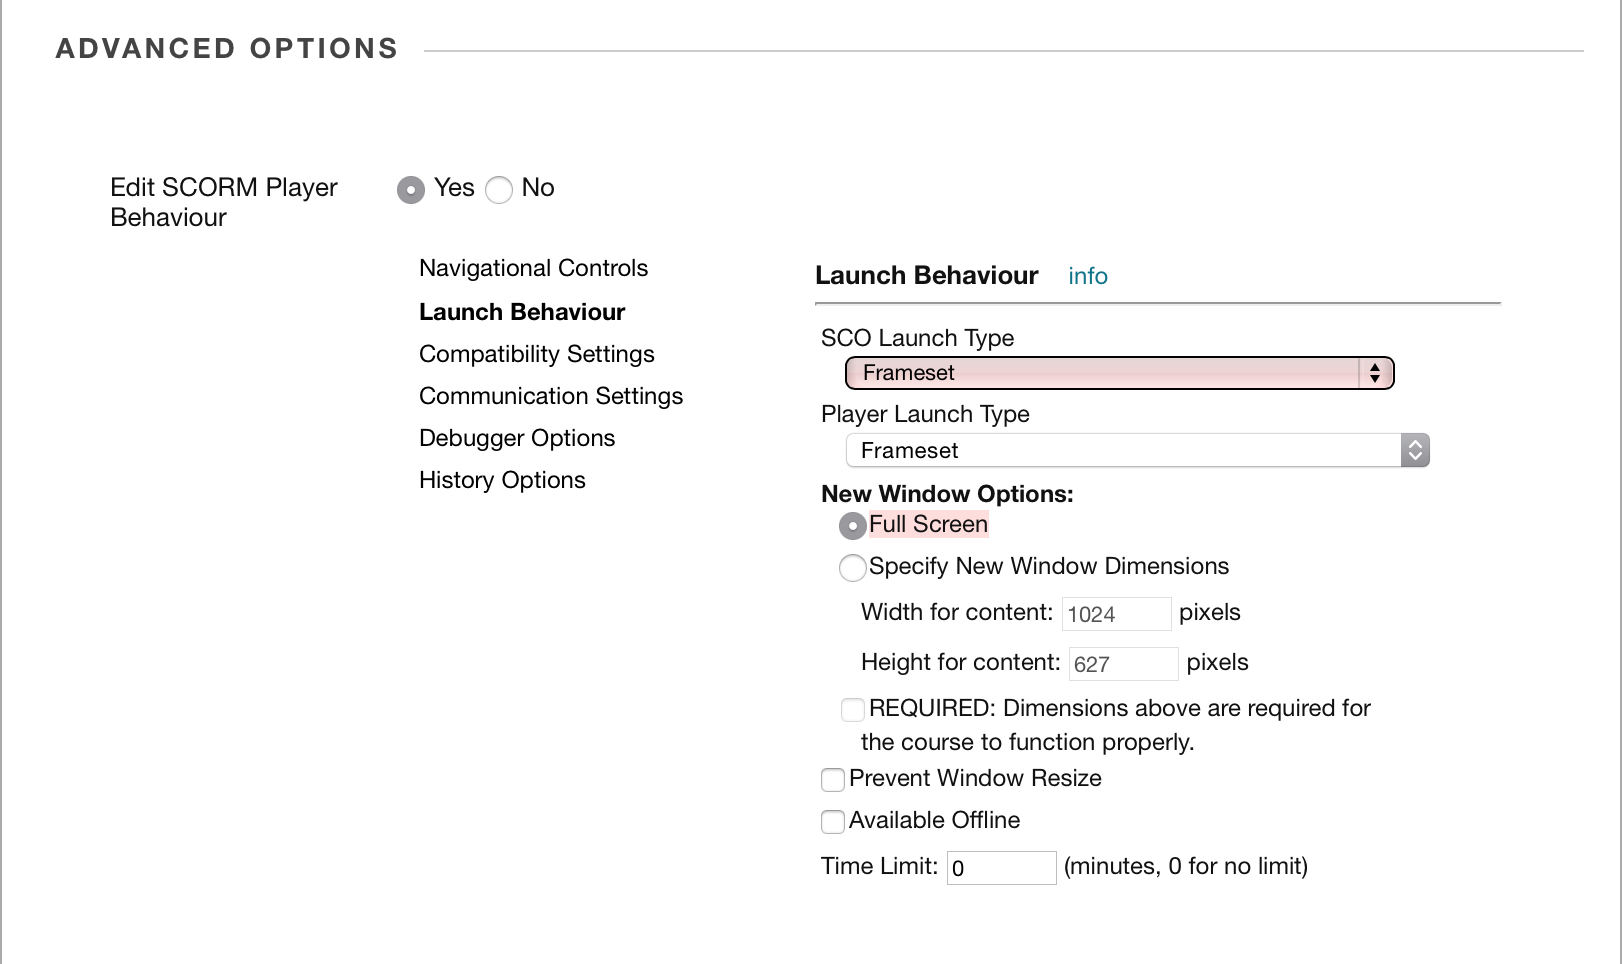
To sort this, you need to edit the content again in Blackboard and make use of a feature that only appears after initially submitting it and does not conform to the Blackboard UI style manual (oh yes there is one!) Below the SCORM AVAILABILITY entry there is now a new entry ADVANCED OPTIONS:

Screen Shot 2015-07-21 at 16.32.36

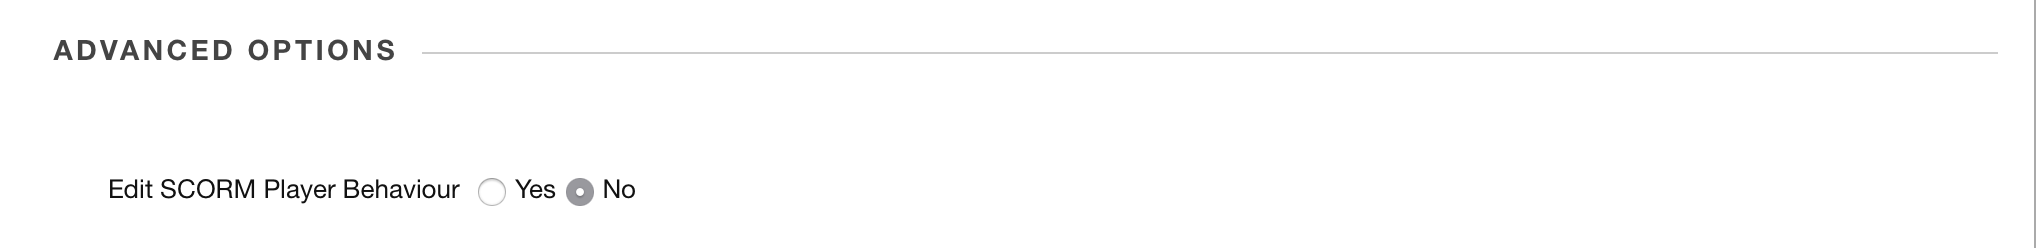
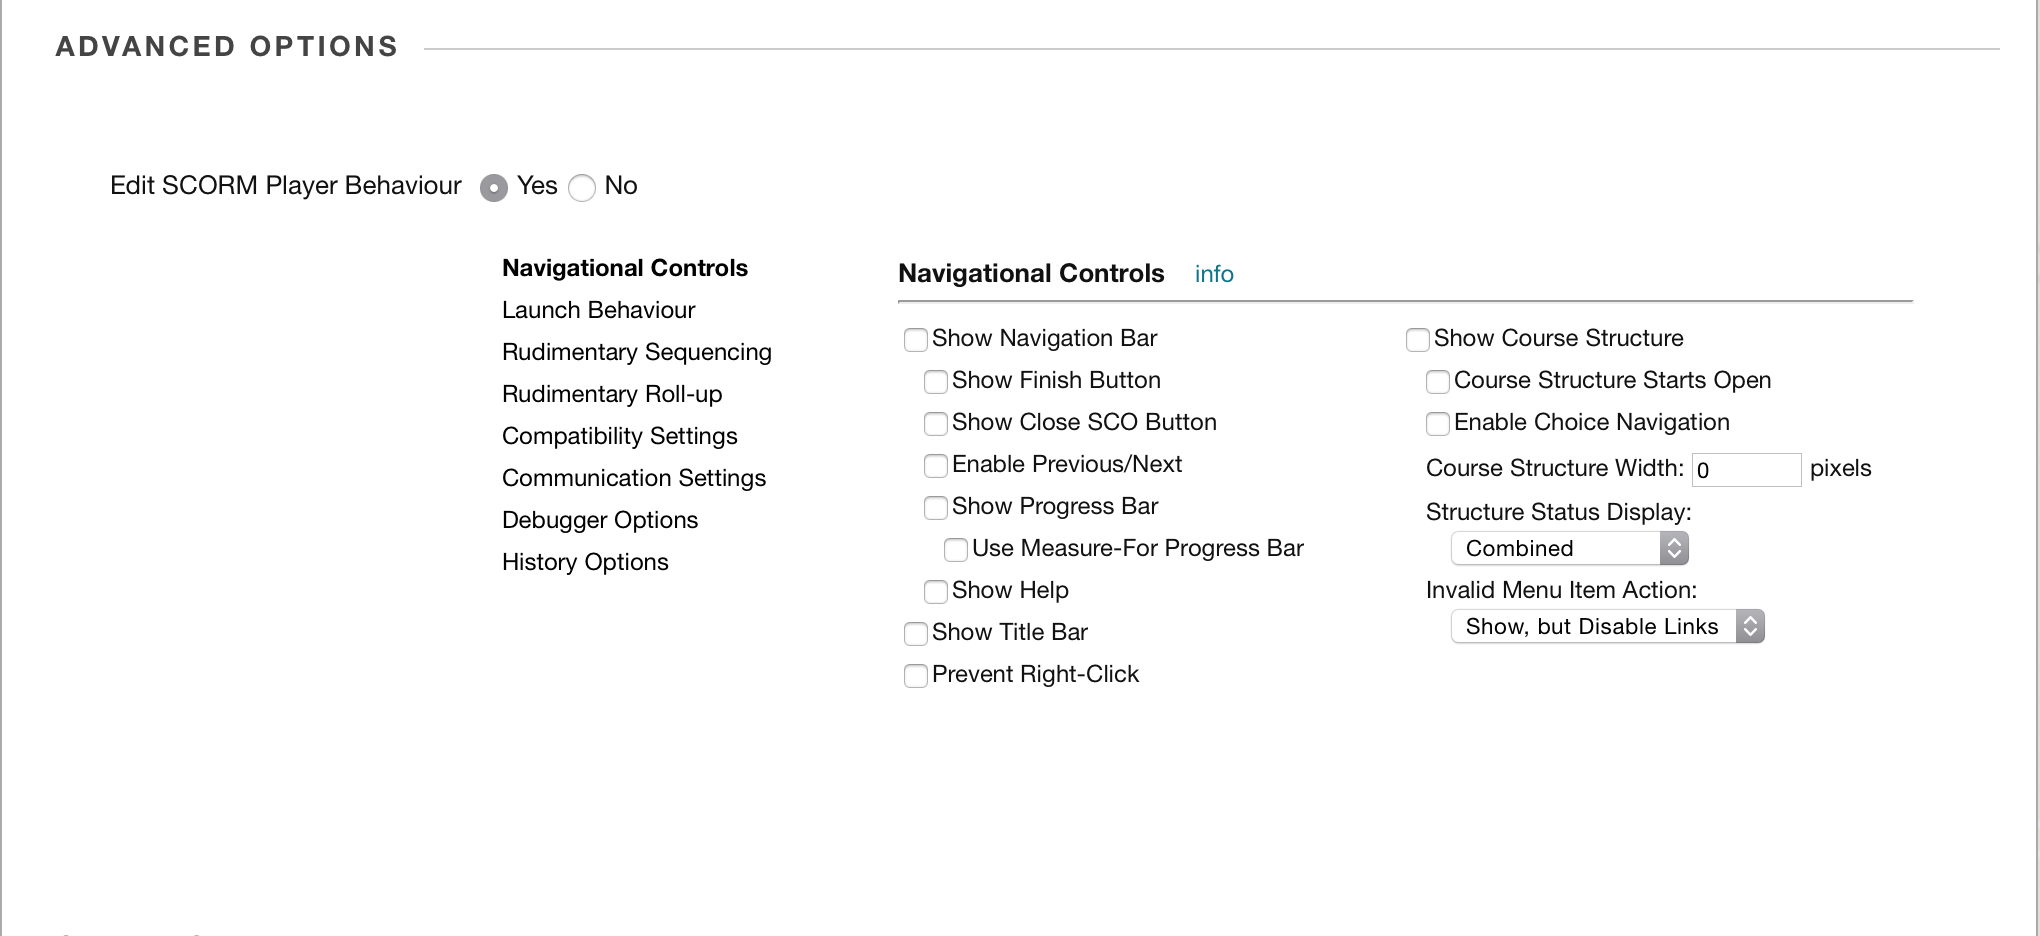
If you change the radio button to Yes, a whole heap of extra options are displayed

The first set relate to the Navigation Controls – these can be important if you want to show/hide the course structure down the left hand side, or display a Close button at the top of the screen:

Screen Shot 2015-07-21 at 16.34.05

Clicking any go the other text below the radio button, e.g. Launch Behaviour gives you more options.
This is where you can set the size of the opening window. The page helpfully highlights any changes in a pretty shade of rose pink:

Screen Shot 2015-07-21 at 16.45.58

That’s it sorted now.

I then repeated the process for the three SCORM 2004 flavours.
Note that as far as configuration within Blackboard goes, in this case the same settings can be applied to all four flavours.

Note, later I explored these settings in more detail. I came across a variable that sets the SCORM edition under Compatibility Settings:

How important is this?

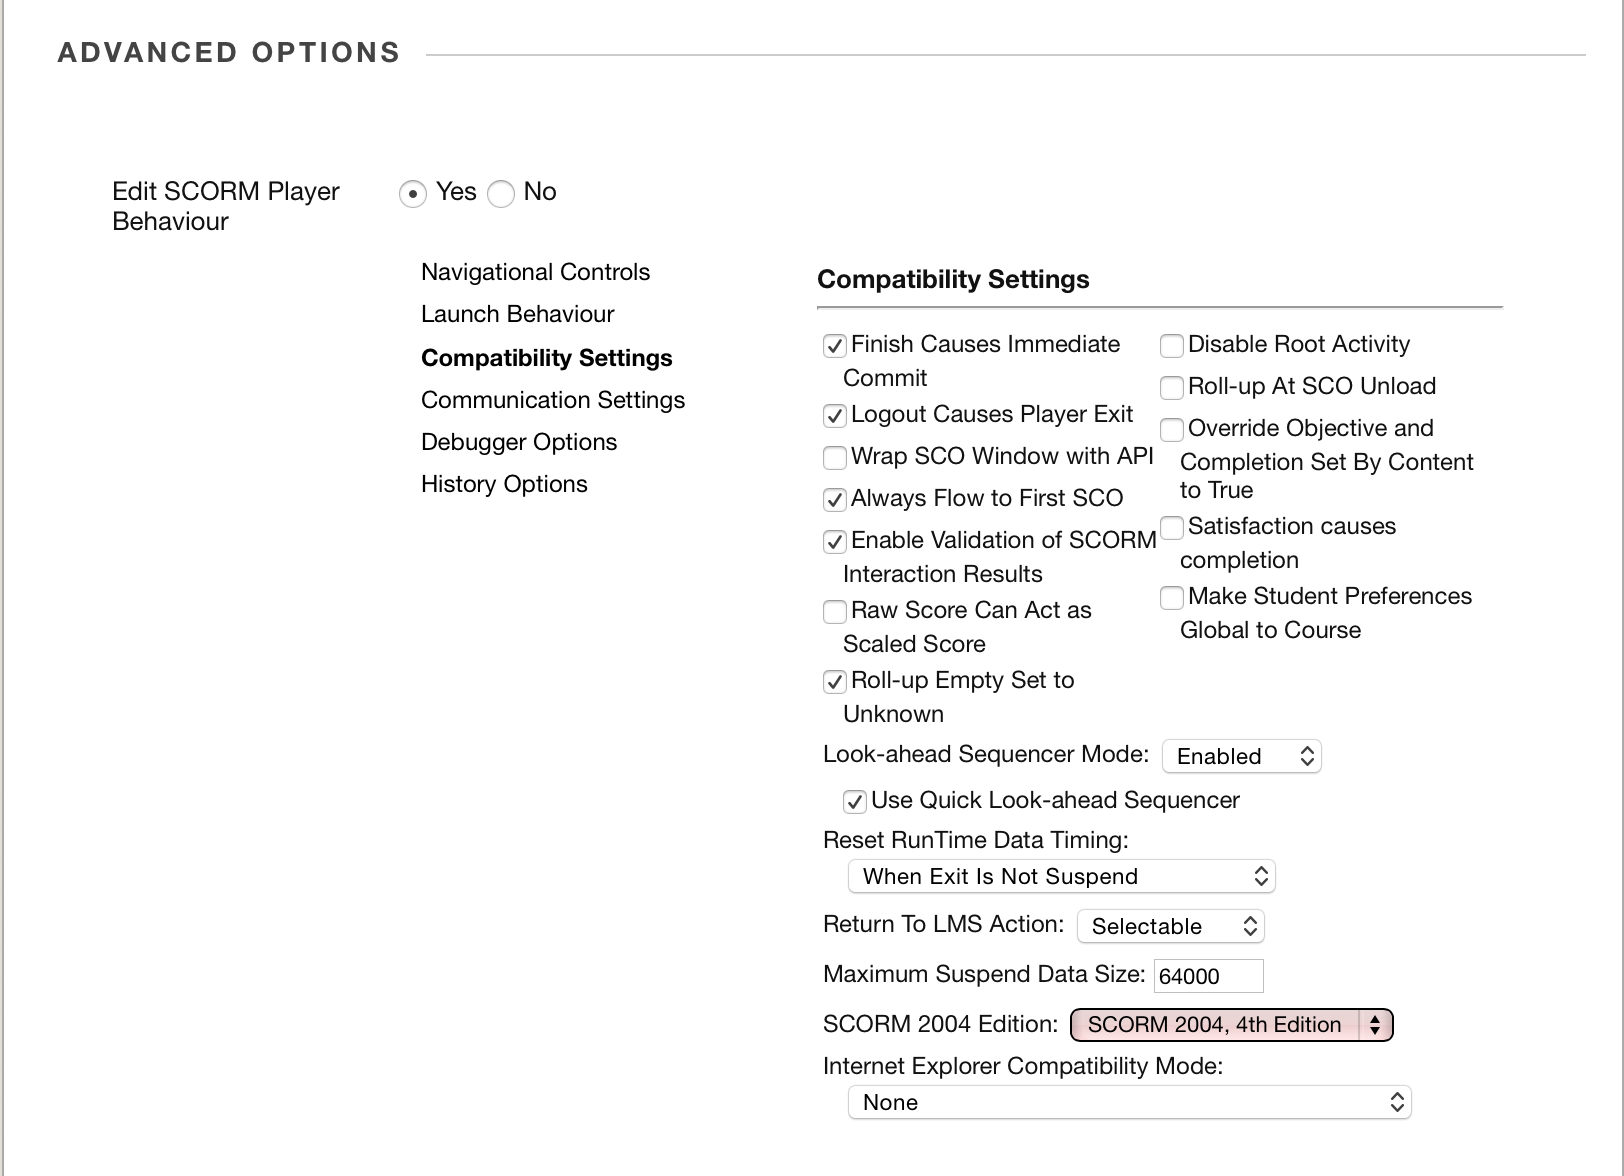
I was not impressed that this was not set correctly by default for the SCORM 2004 items – it seems to default to the 2nd Edition 😦
On the up side, changing this did not seem to make any difference to the content item’s behaviour.
The SCORM 1.2 did not have this setting, so at least it detected that correctly!

Completing the Tests

I then logged in as a student and completed the four SCORM objects. You could not tell the difference from the user perspective.

I will come back and look at the experience using a range of devices (laptop browser, mobile browser and mobile app).

Logging back in as an instructor, I can see the entries for each SCORM item in the Grade Centre:

Screen Shot 2015-07-22 at 11.11.21

To see the detail of any given attempt, you have to select it using the context menu at the right hand side of the entry:

see an attempt

To cut to the chase, there is a difference in the data displayed from SCORM 1.2 and SCORM 2004 items, but no difference between the various SCORM 2004 flavours:

SCORM 1.2 2nd Edition
SCORM 1.2 3rd Edition
SCORM 2004 2nd Edition
SCORM 2004 3rd Edition
SCORM 2004 4th Edition

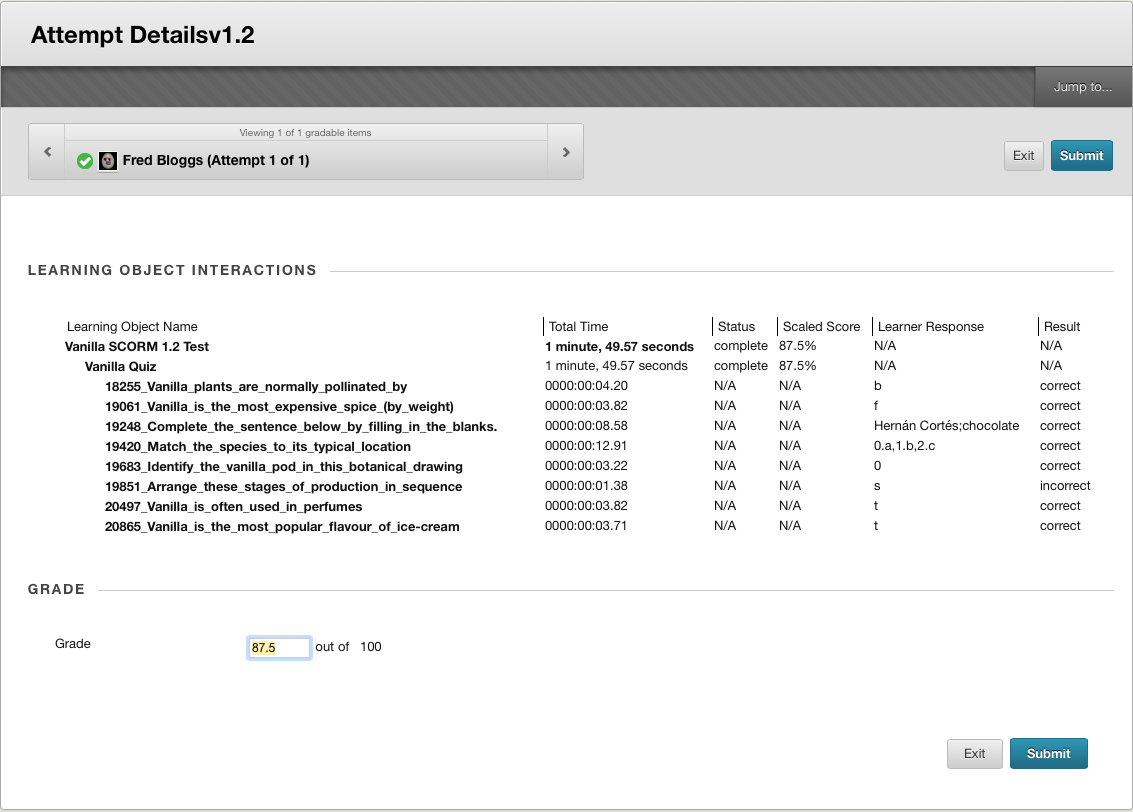
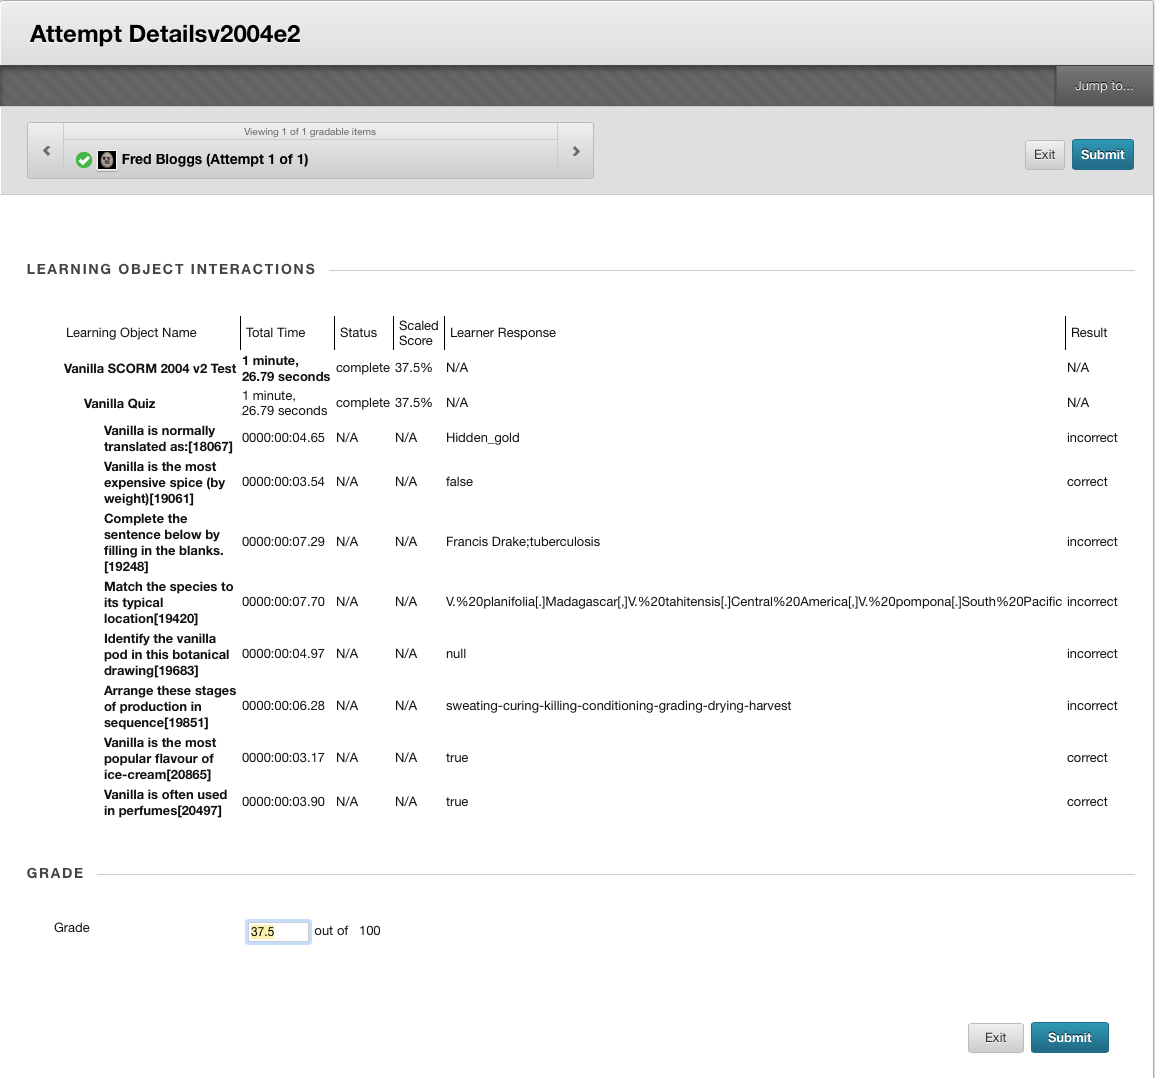
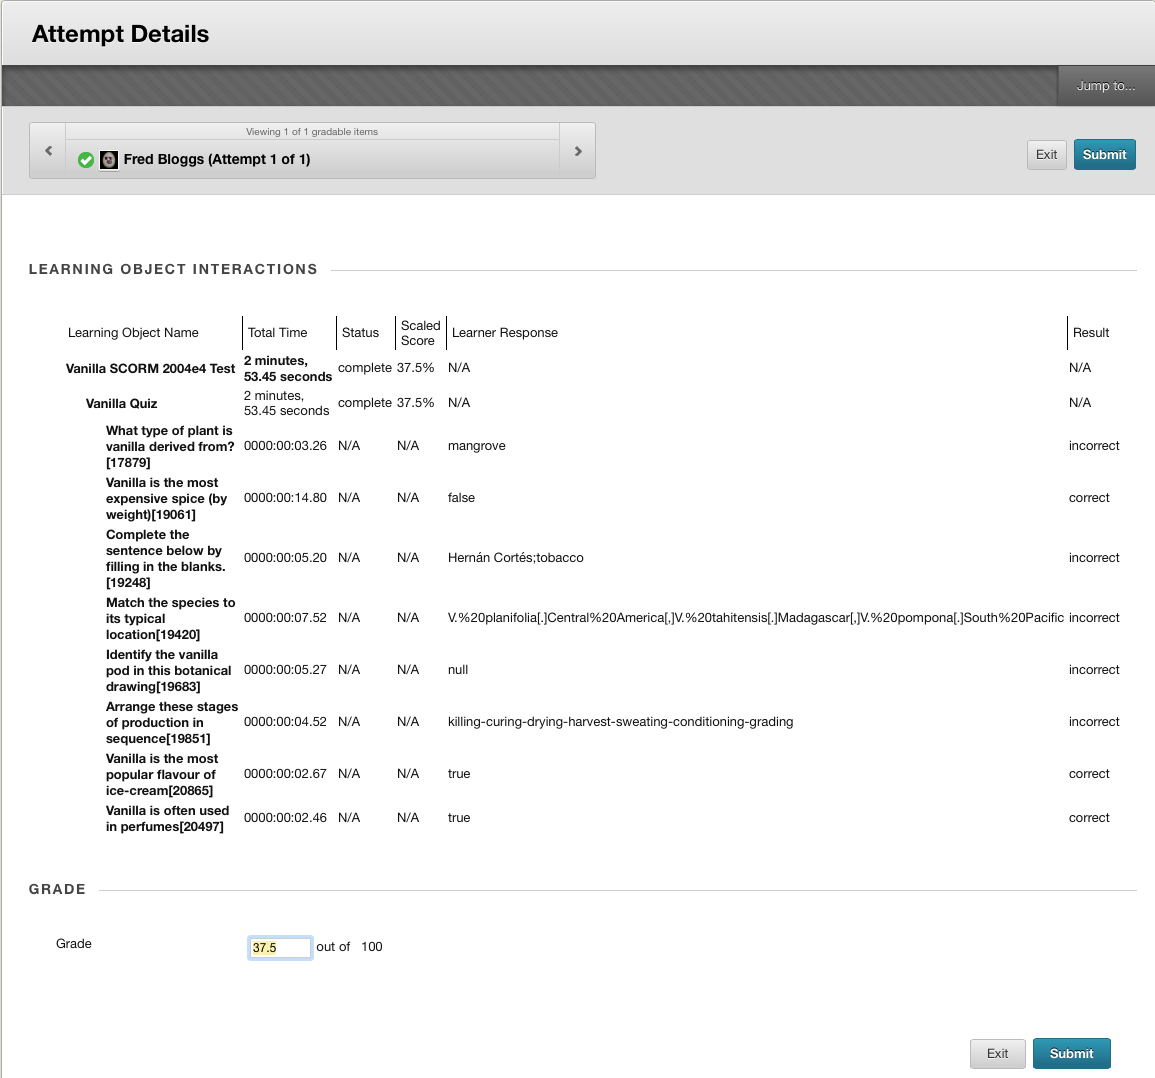
The key advantage of the SCORM 2004 format is that you see the text of the answer selected by the user, rather than just an identifier (e.g. a, b, etc.).

The utility of the response varies by question type. For text responses it is easy to see which response the learner chose and whether it was correct, but for some (e.g. hotspots, where just the co-ordinates are displayed) or ordering (where you need to parse (URLDecode) the entries selected) you need to pay much closer attention.

It is interesting to see how long a student spends on each question.

That’s about as good as it gets though. There is no overview available across all the students on the course, no ability to analyse the effectiveness (discriminatory power) of the individual questions.

Item Analysis

Compare the results above, with the sort of analysis that comes out the box for the much-derided Blackboard Quiz:

From the Control Panel in a Course:
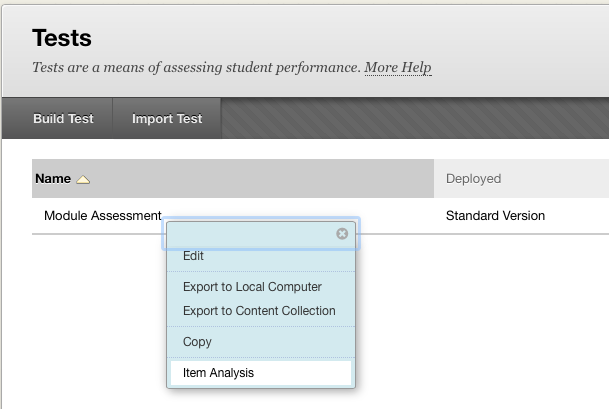
Course Tools | Tests, Surveys and Pools | Tests
and from the context menu next to the corresponding Test choose Item Analysis

Item Analysis

Running the analysis can take some time (especially if the class contains a lot of students) but the results are worthwhile.

In the screenshots below I am displaying Item Analysis results for the same questions used in the SCORM package, but deployed as a Blackboard Test.

The Item Analysis starts with a summary of the test, how many people have taken it, and an indication of how individual questions score in terms of difficulty (the percentage of students who answered it correctly) and how discriminatory (the ability to discriminate between students who know the subject matter and those who don’t based on the response to this question) they are.

Screen Shot 2015-07-22 at 12.12.17


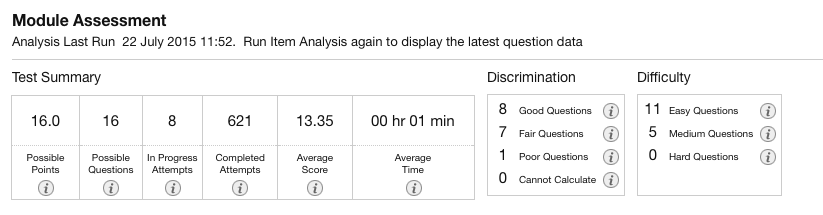
Below the table is a list showing the results for each question in detail. You can filter this, e.g. to show just the questions with a poor discrimination value:

poor questions


After applying several filters to get a feel for the data, you can drill into each question to see the statistics behind these measures:

fair questions


In this table we see columns of figures. The first shows the breakdown of responses across all learners. E.g. 3.87% of all the people who worked through this material thought (wrongly) that Vanilla translates as “Nectar of the gods”.

The remaining columns show the responses selected for four groups of learners, grouped by their final score. So we can see that none of the people whose final score placed them in the top 25% (Q1) chose the option “Nectar of the Gods’, whilst 15 of the people in the bottom 50-75% (Q3) selected it, and 6 of those in the lowest 25% (Q4) chose it. This information is very useful when you come to review the questions.

It would be great if this information was available from SCORM content too, but at least in the Blackboard implementation, this information is not available.

Recommendation

I think SCORM can be used to deploy custom content, to convey information, introduce new ideas and help students assimilate this information into their own mental model. If you are only interested in the final numerical result, then it makes sense to include a test within the SCORM content. SCORM 2004 provides better reporting than SCORM 1.2.

If, however, you want to be able to refine the questions and possibly tune the training materials based on repeated wrong answers, then I think at present it is better to decouple the quiz from the SCORM object and deploy it as a separate stand alone test (possibly only visible once the learner has completed the SCORM packaged content at least once). This also gives you more flexibility should you want students to retake the test later and possibly revisit the materials if they fail the test the second time.

Device-Dependent Display

I also wanted to test the way the content was deployed using a range of configurations. The Captivate project used a responsive template, so the content uses one of three defined layouts, with break points defined at display widths of 1024 pixels (desktop), 768 pixels (tablet) and 360 pixels (mobile):

Desktop Layout
Desktop Layout


Tablet layout
Tablet Layout


Mobile Layout
Mobile Layout

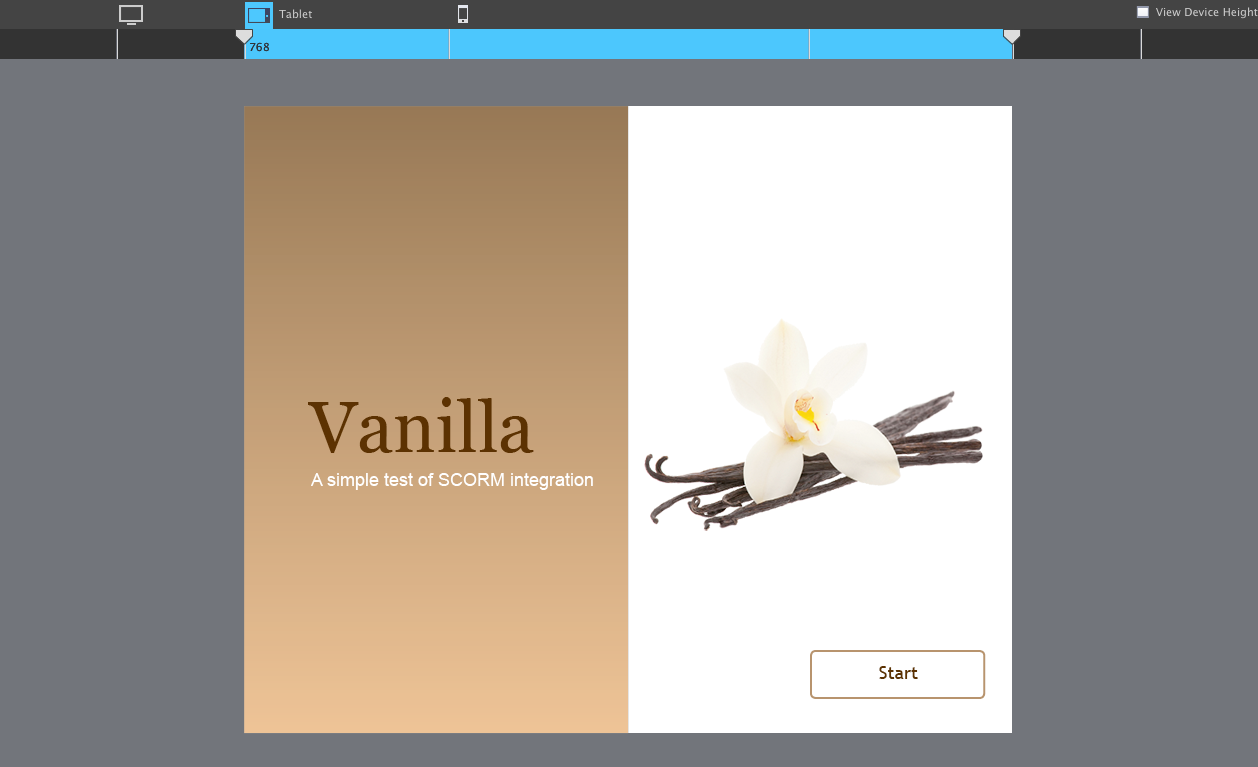
To test this I launched the course using a laptop and a tablet. I considered using  a mobile phone too, but I think this form factor is really too small for much e-learning content. For the laptop I wanted to see the effect of resizing the window. For the mobile devices, I wanted to see if it reacted to a change in orientation.

Standard Browser

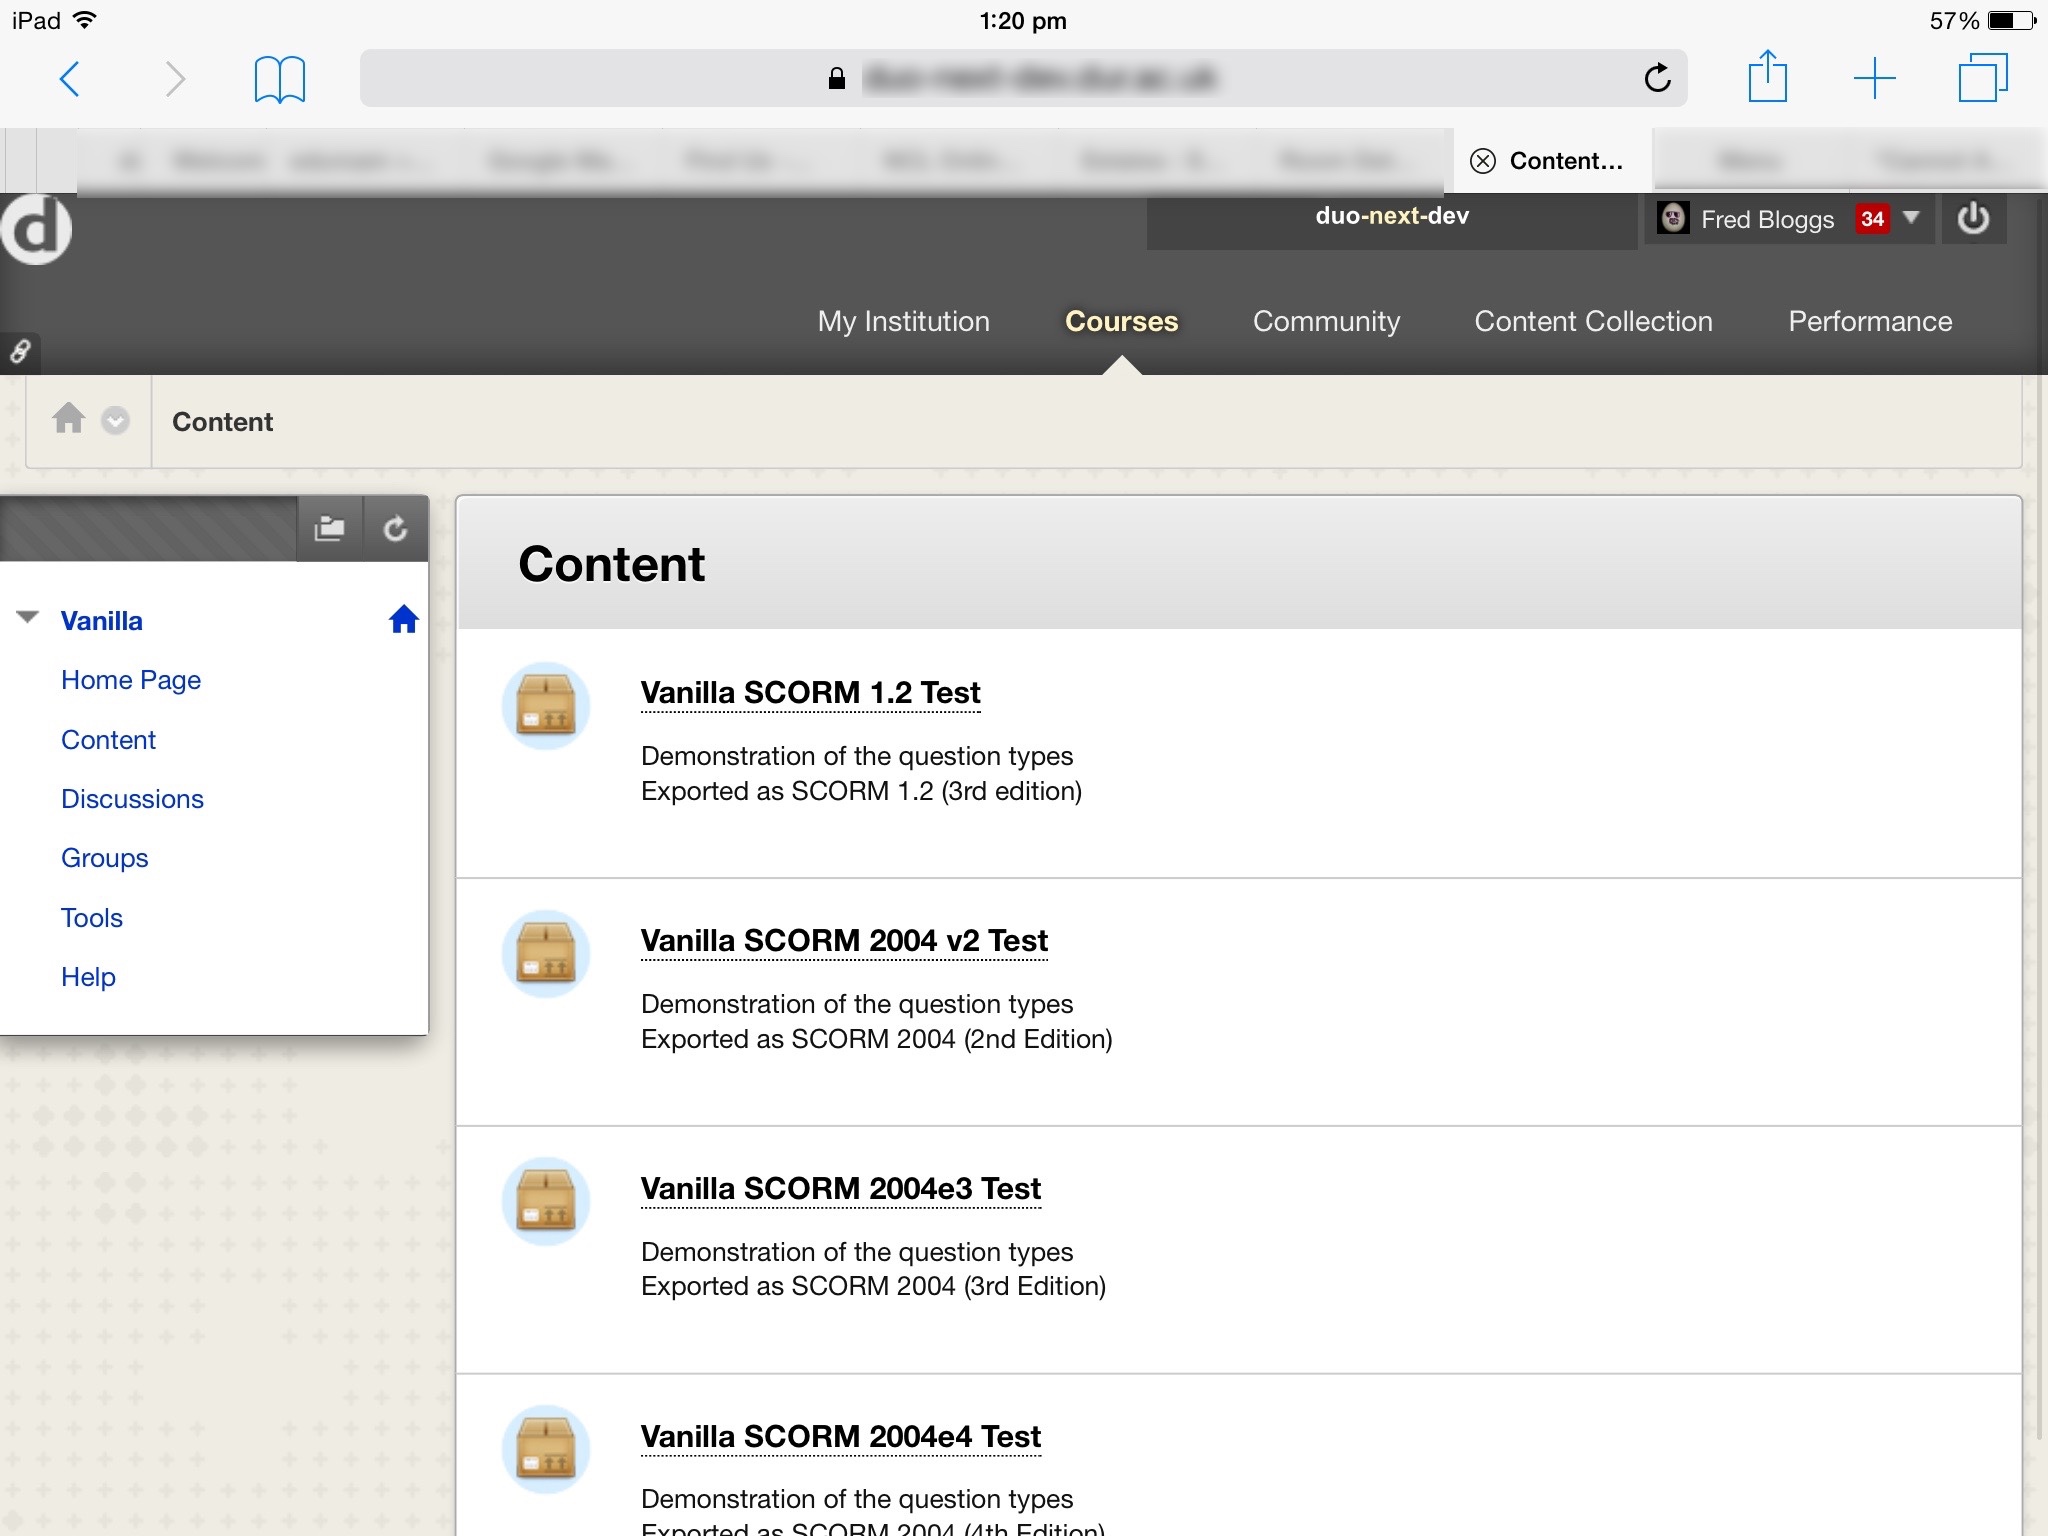
The link appears as a normal content item:

No surprises here :-)
No surprises here 🙂

Clicking the link causes a new window to open. The SCORM content plays in this, filling the screen. The content of the window underneath is repainted to show that the SCORM player has launched in a new window.

laptop launch
It is also possible to display a title bar across the top and the table of contents down the LHS if you want – they are not appropriate for this content.

When you have worked through the materials and close the SCORM player (And so it’s window) , there is a short delay, then the remaining window is updated, returning you to the content items again.

I then tried resizing the popup window to see how the content layout responded.

When I started narrowing the window width, the content did resize to a layout more like the Tablet option set in Captivate:

The Start button doesn't look quite right
Some of the text has not flowed particularly elegantly, but it is all visible

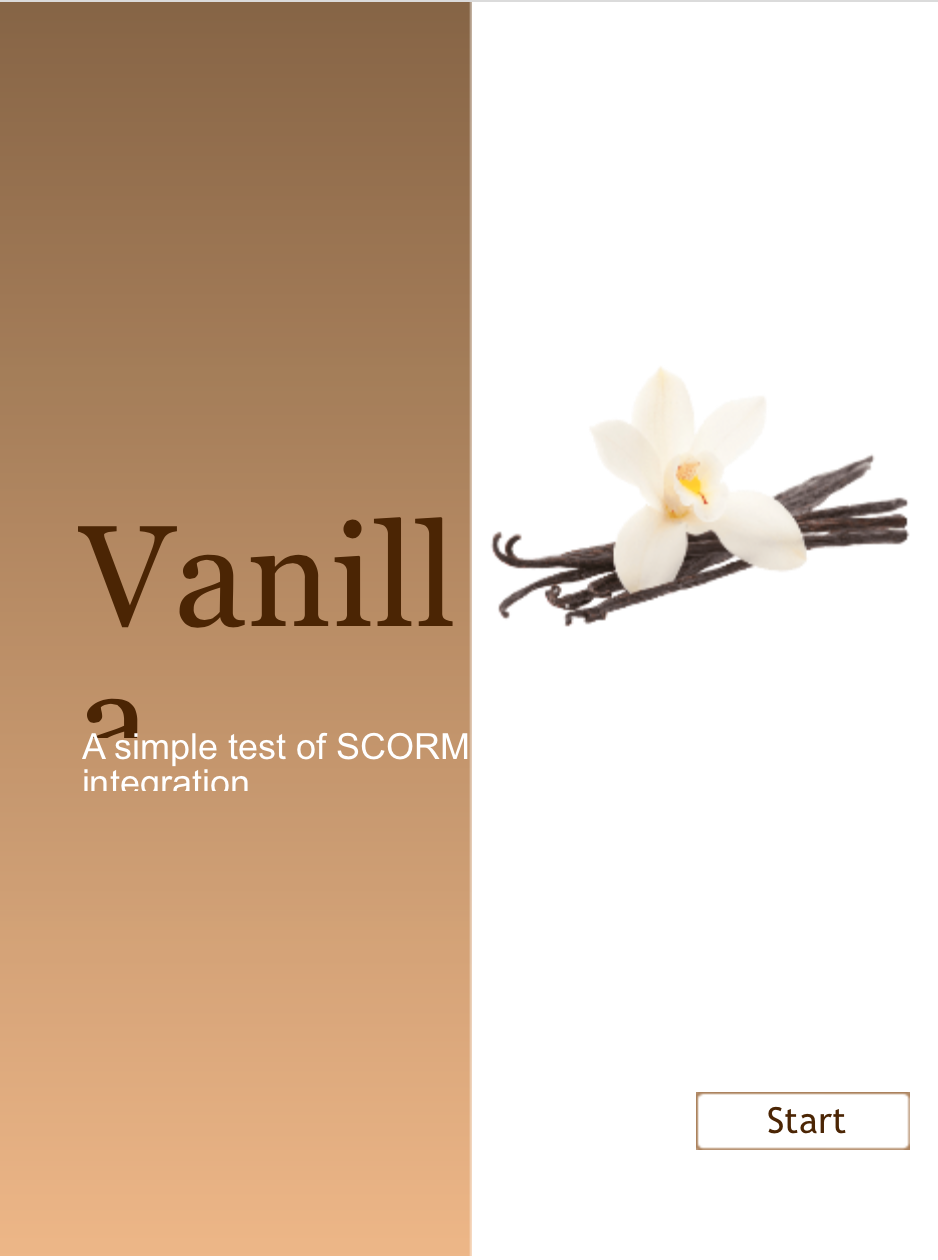
When I continued to reduce the width, it eventually flipped to the Mobile layout:

Perhaps surprisingly, this factor appears better

As such, although with a few layout issues, the SCORM content is acting in a responsive manner when viewed on a desktop/laptop.

Mobile Browser

This test was carried out using an iPad, accessing Blackboard using the built in Safari browser:

Very similar to the laptop experience at present

Things didn’t quite go as expected when I clicked the link to open a SCORM item. Instead of a new window I got this:

Safari didn't like the popup window
Safari didn’t like the popup window

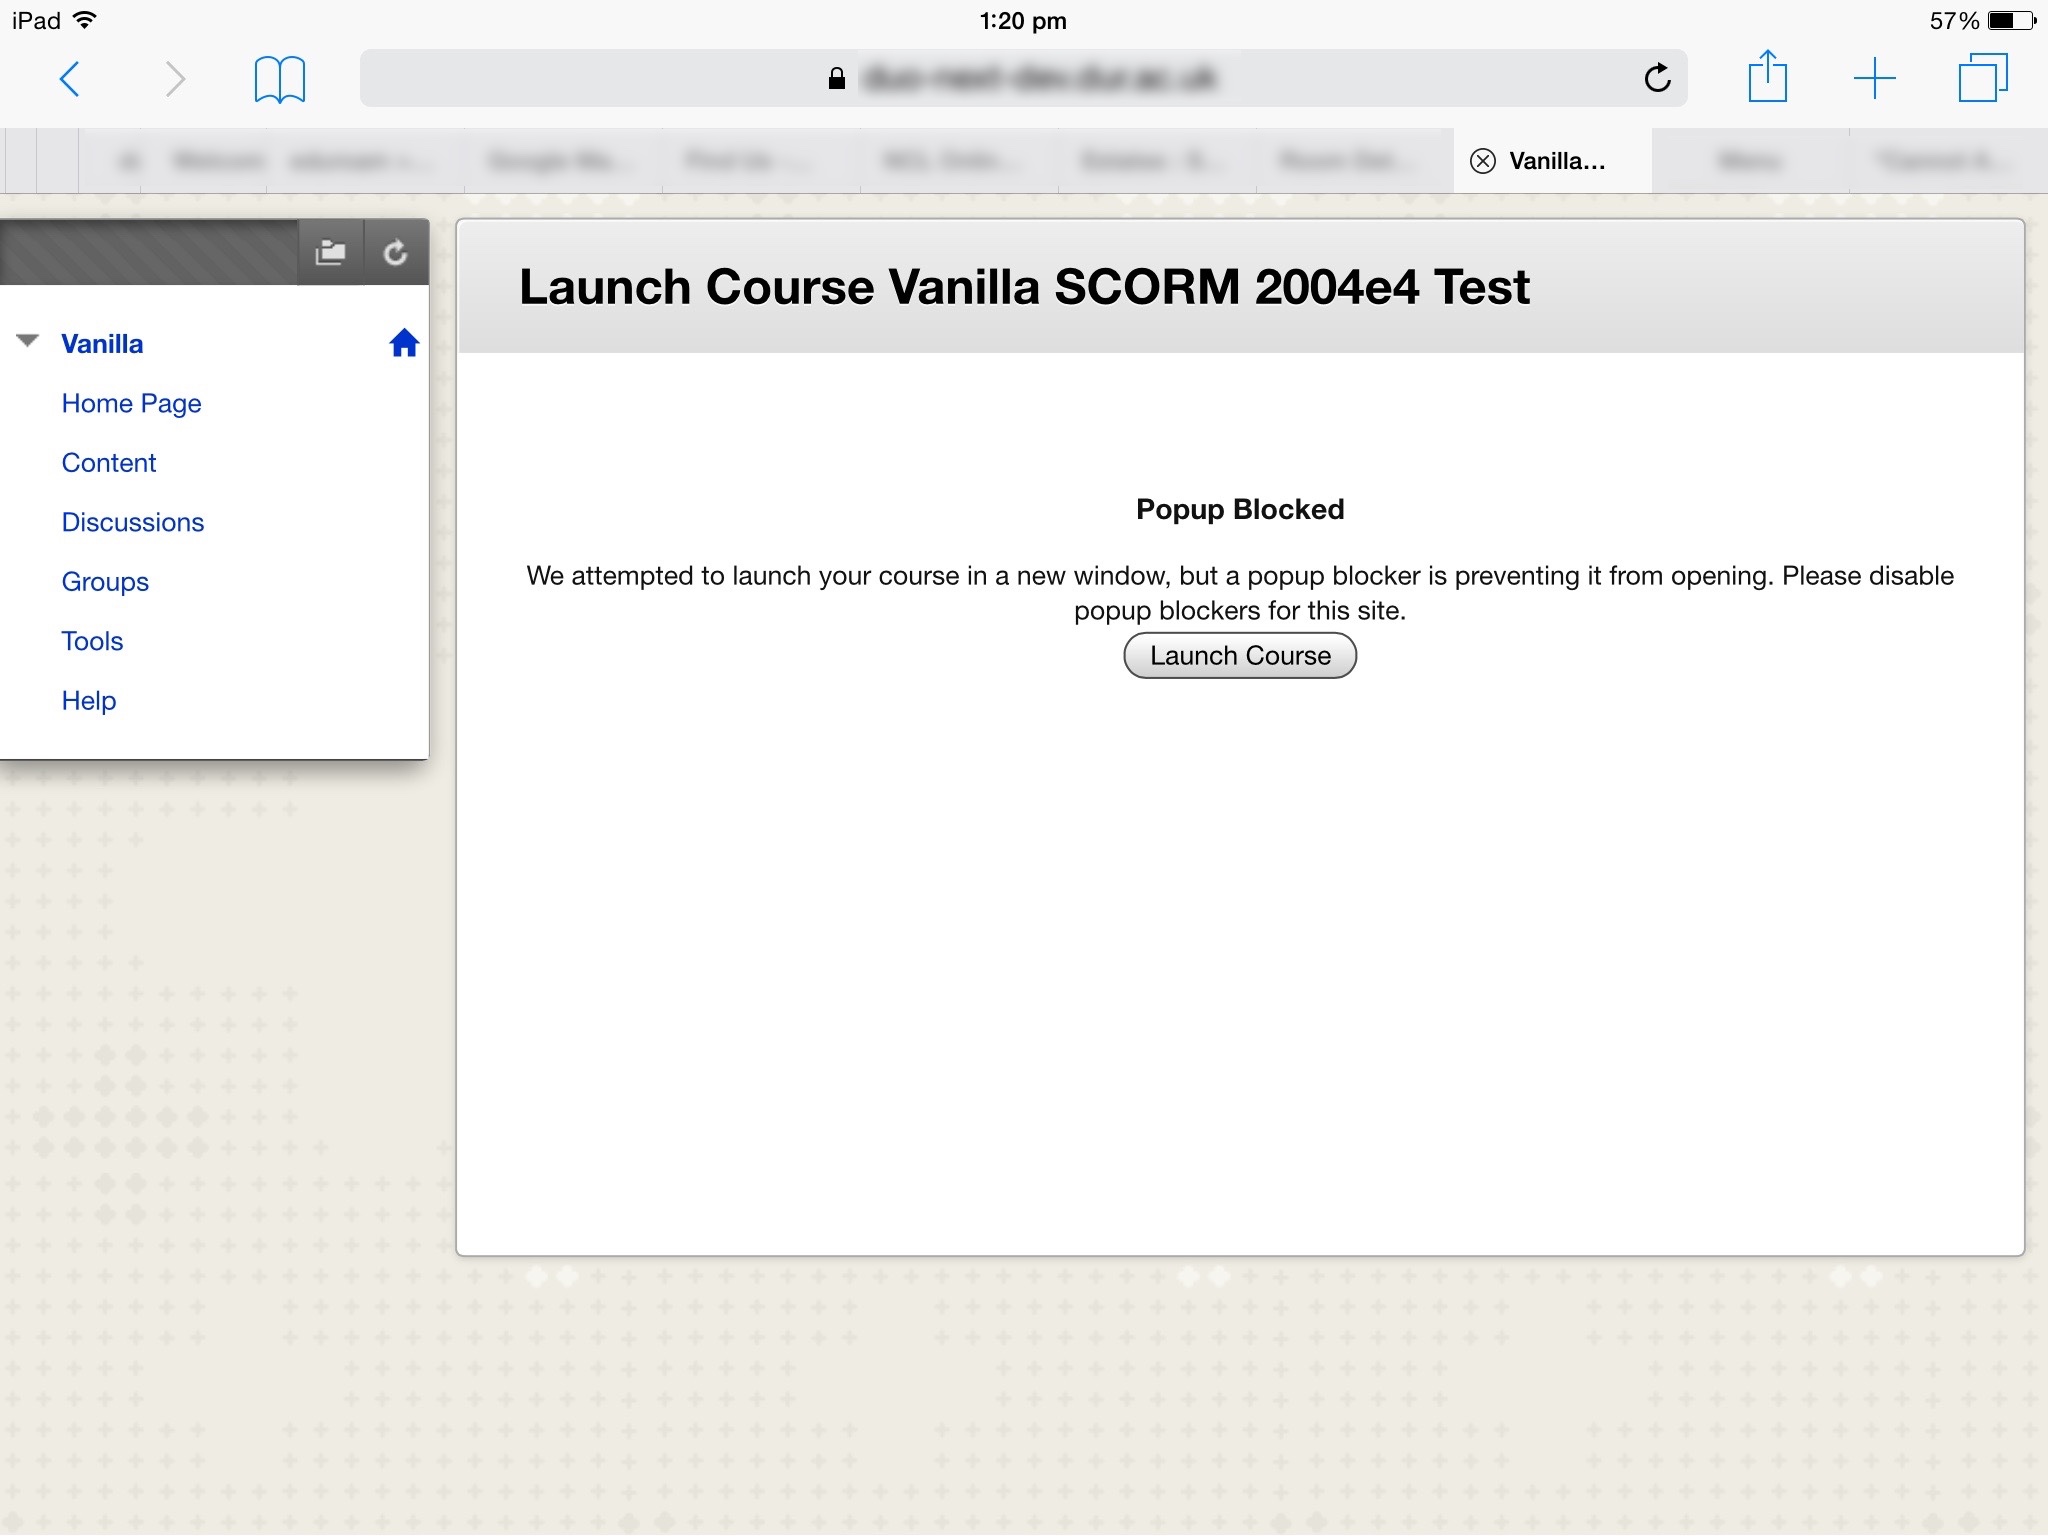
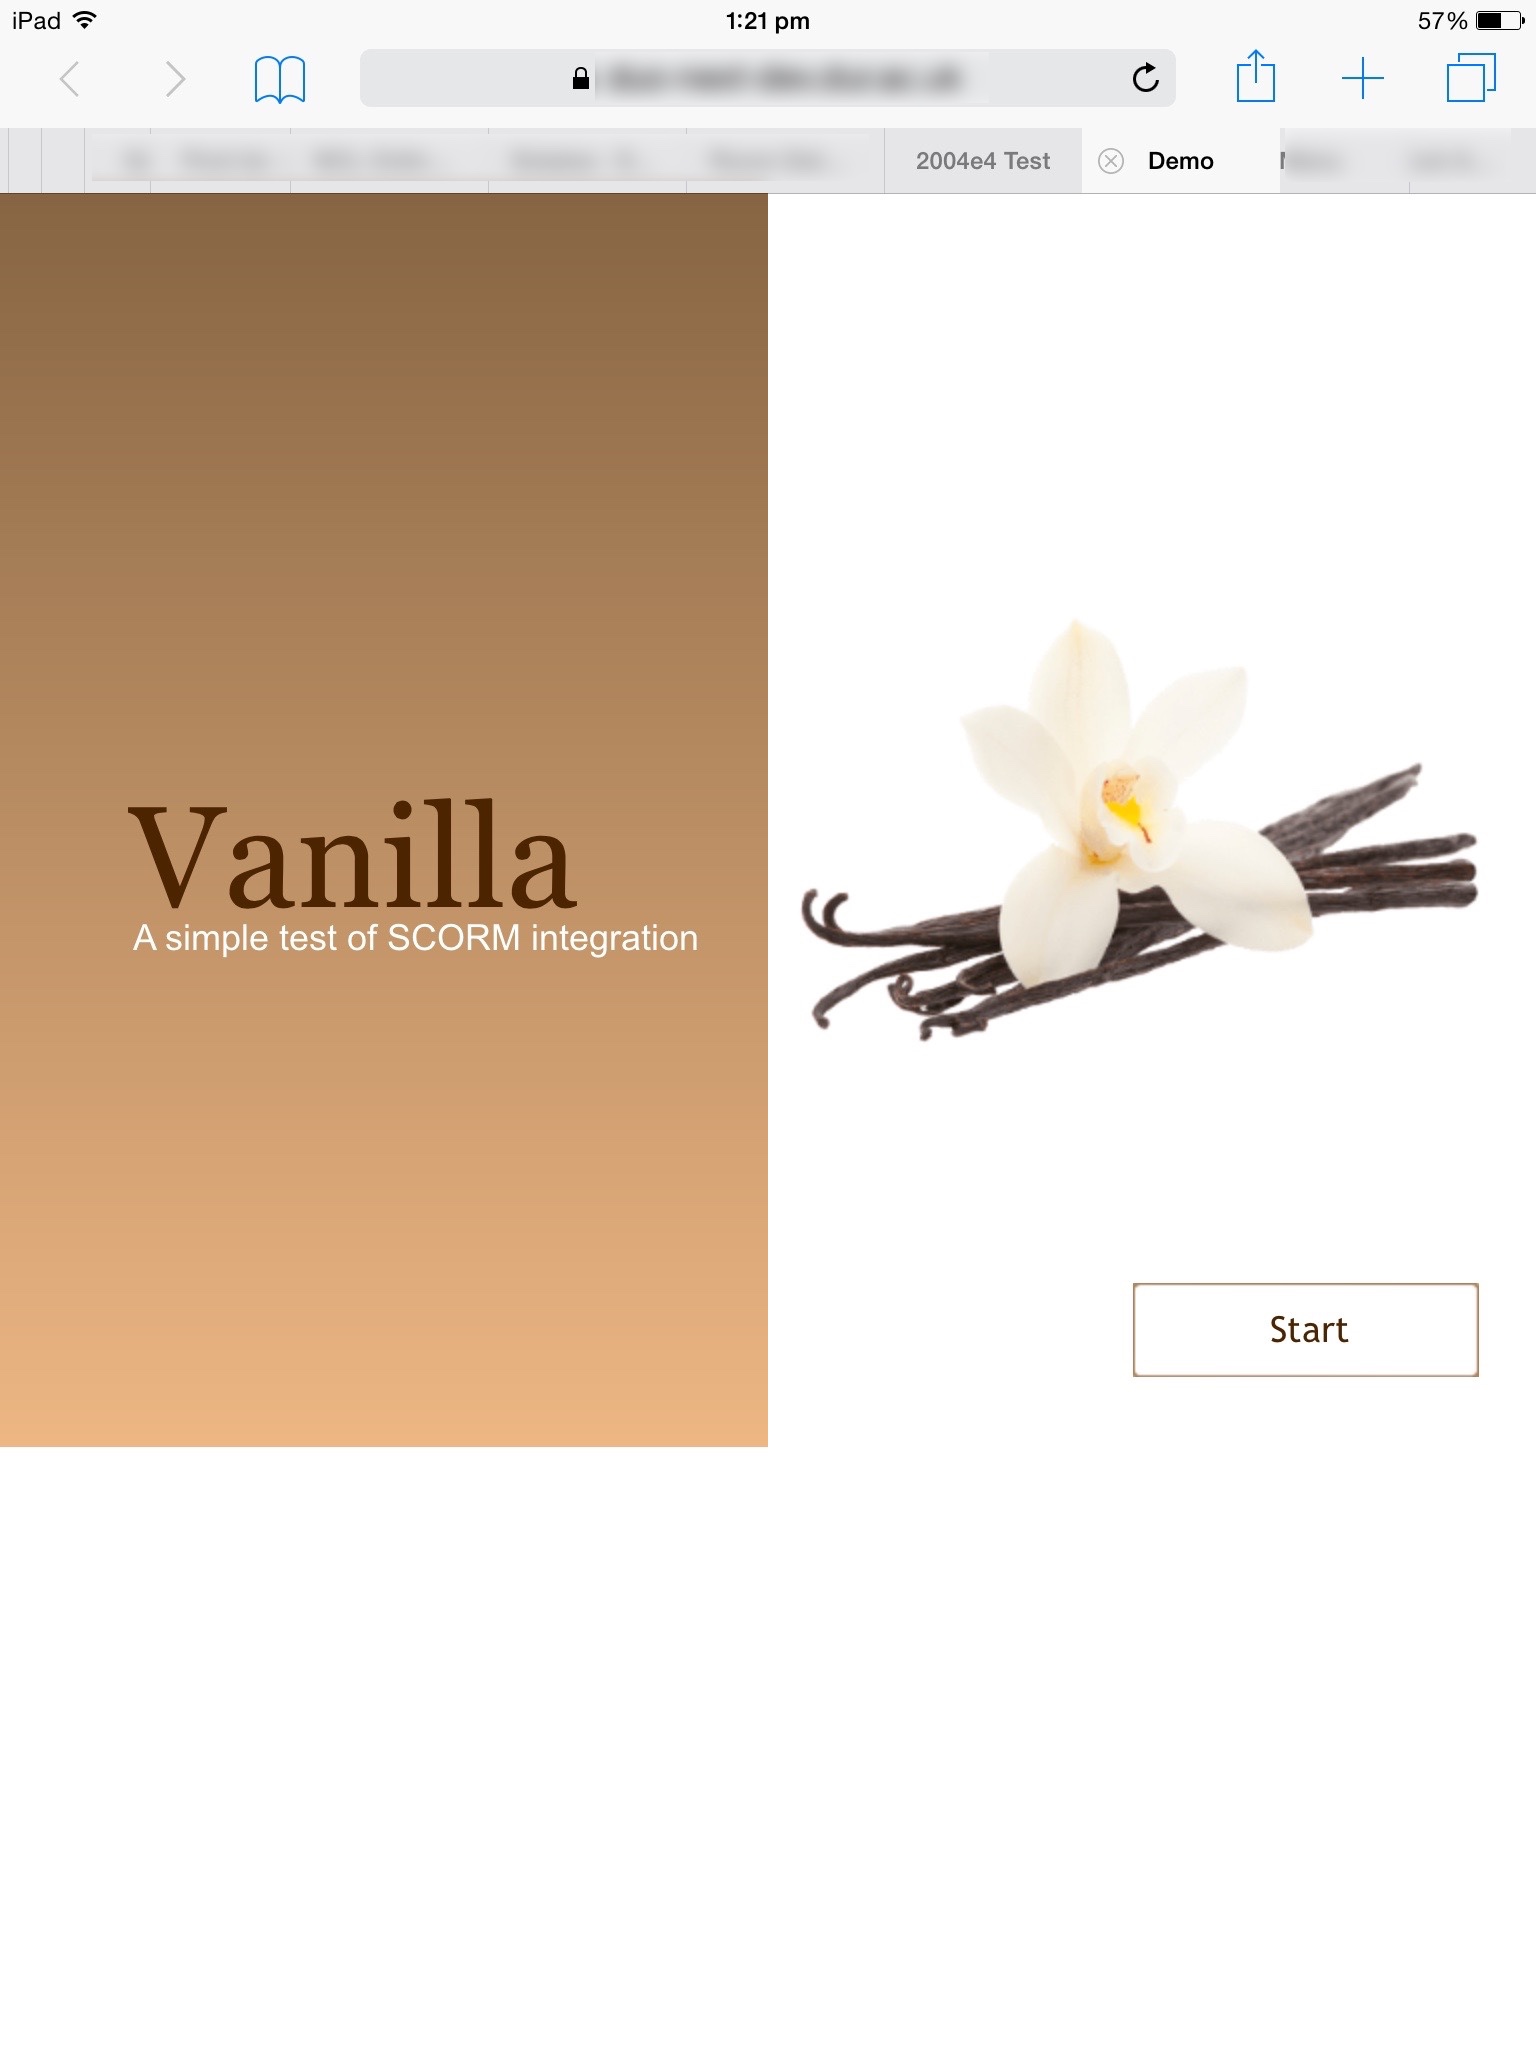
If I then clicked the Launch Course button the player is launched.
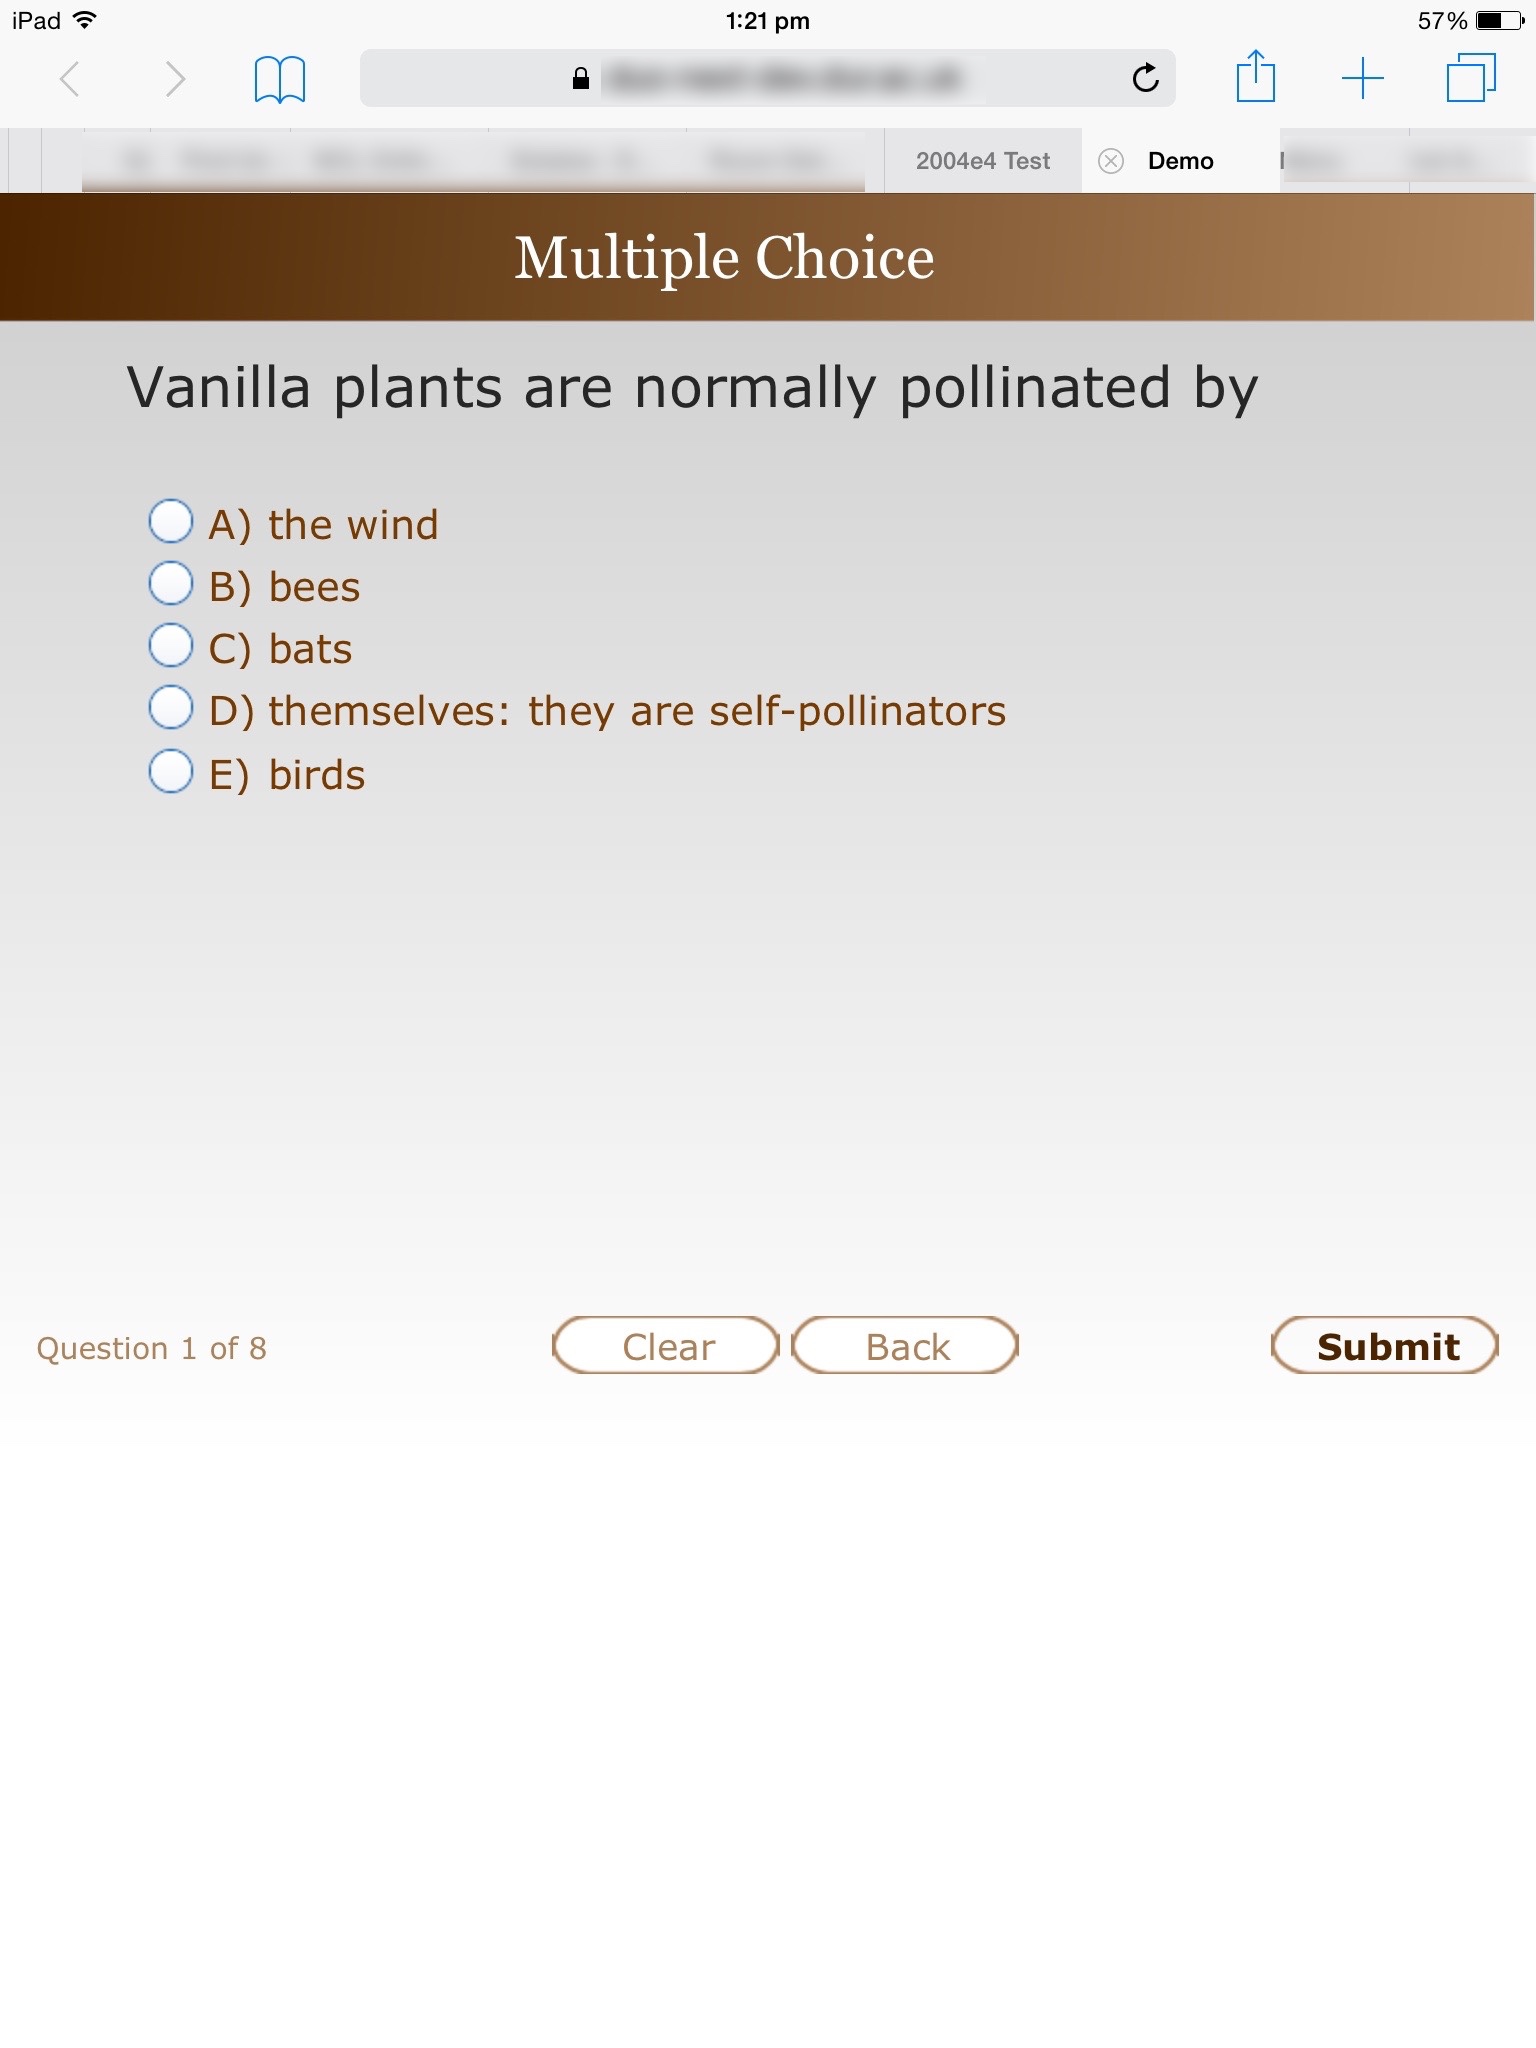
Unlike the desktop browser though, the opening screen is intercepted with this standard Captivate screen designed to provide help for mobile users:

The icon at the top right opens guidance for using gestures

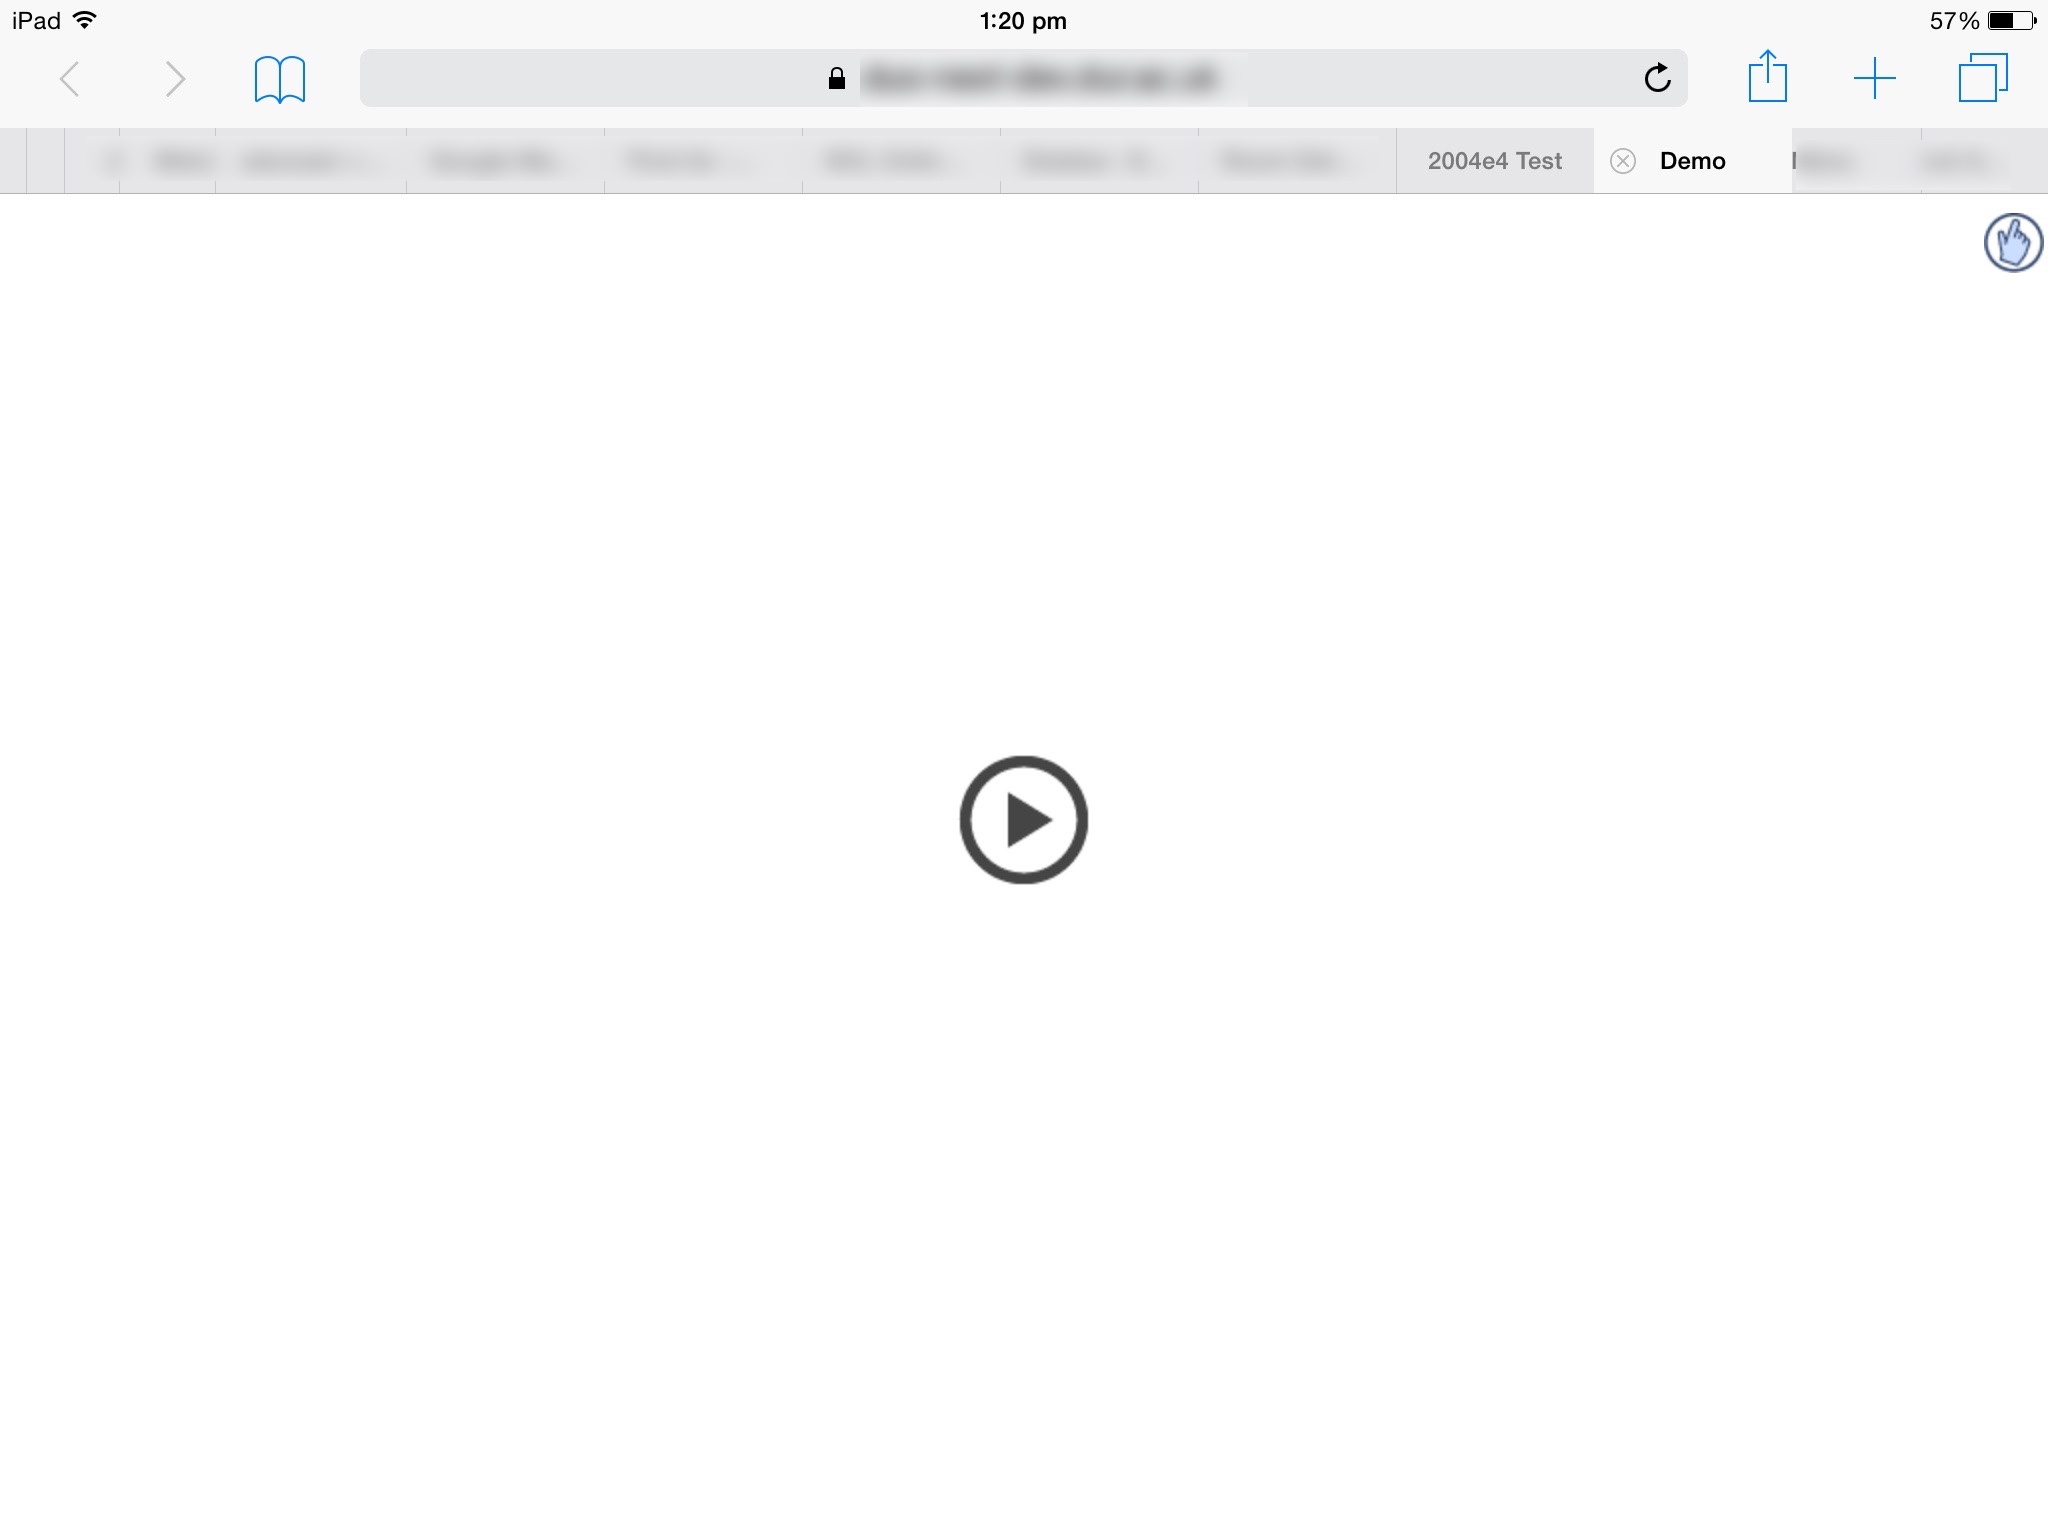
If you click on the Gesture icon, these instructions are displayed:

Handy as they are not all immediately obvious

Click the screen again to dismiss this information, then click on the player icon to finally launch the content:

Launched in landcsape
Launched in landscape

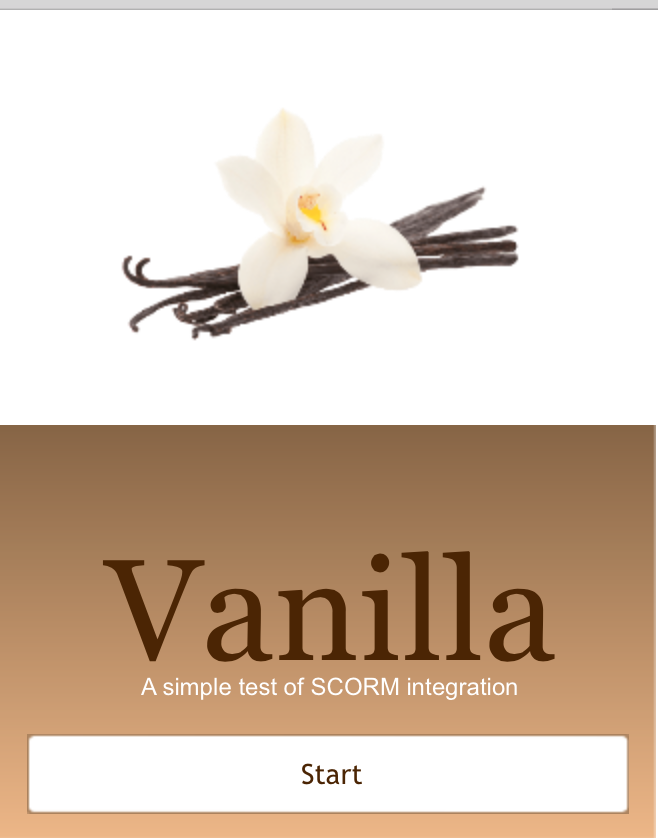
If you rotate the tablet, the content is flows to (at least partially support) the portrait orientation:

After rotating the tablet
After rotating the tablet (note the larger Start button, because we are now below the 1024 pixel width setting)


When you have finished working through the content and close the SCORM object, you are returned to the course as before.

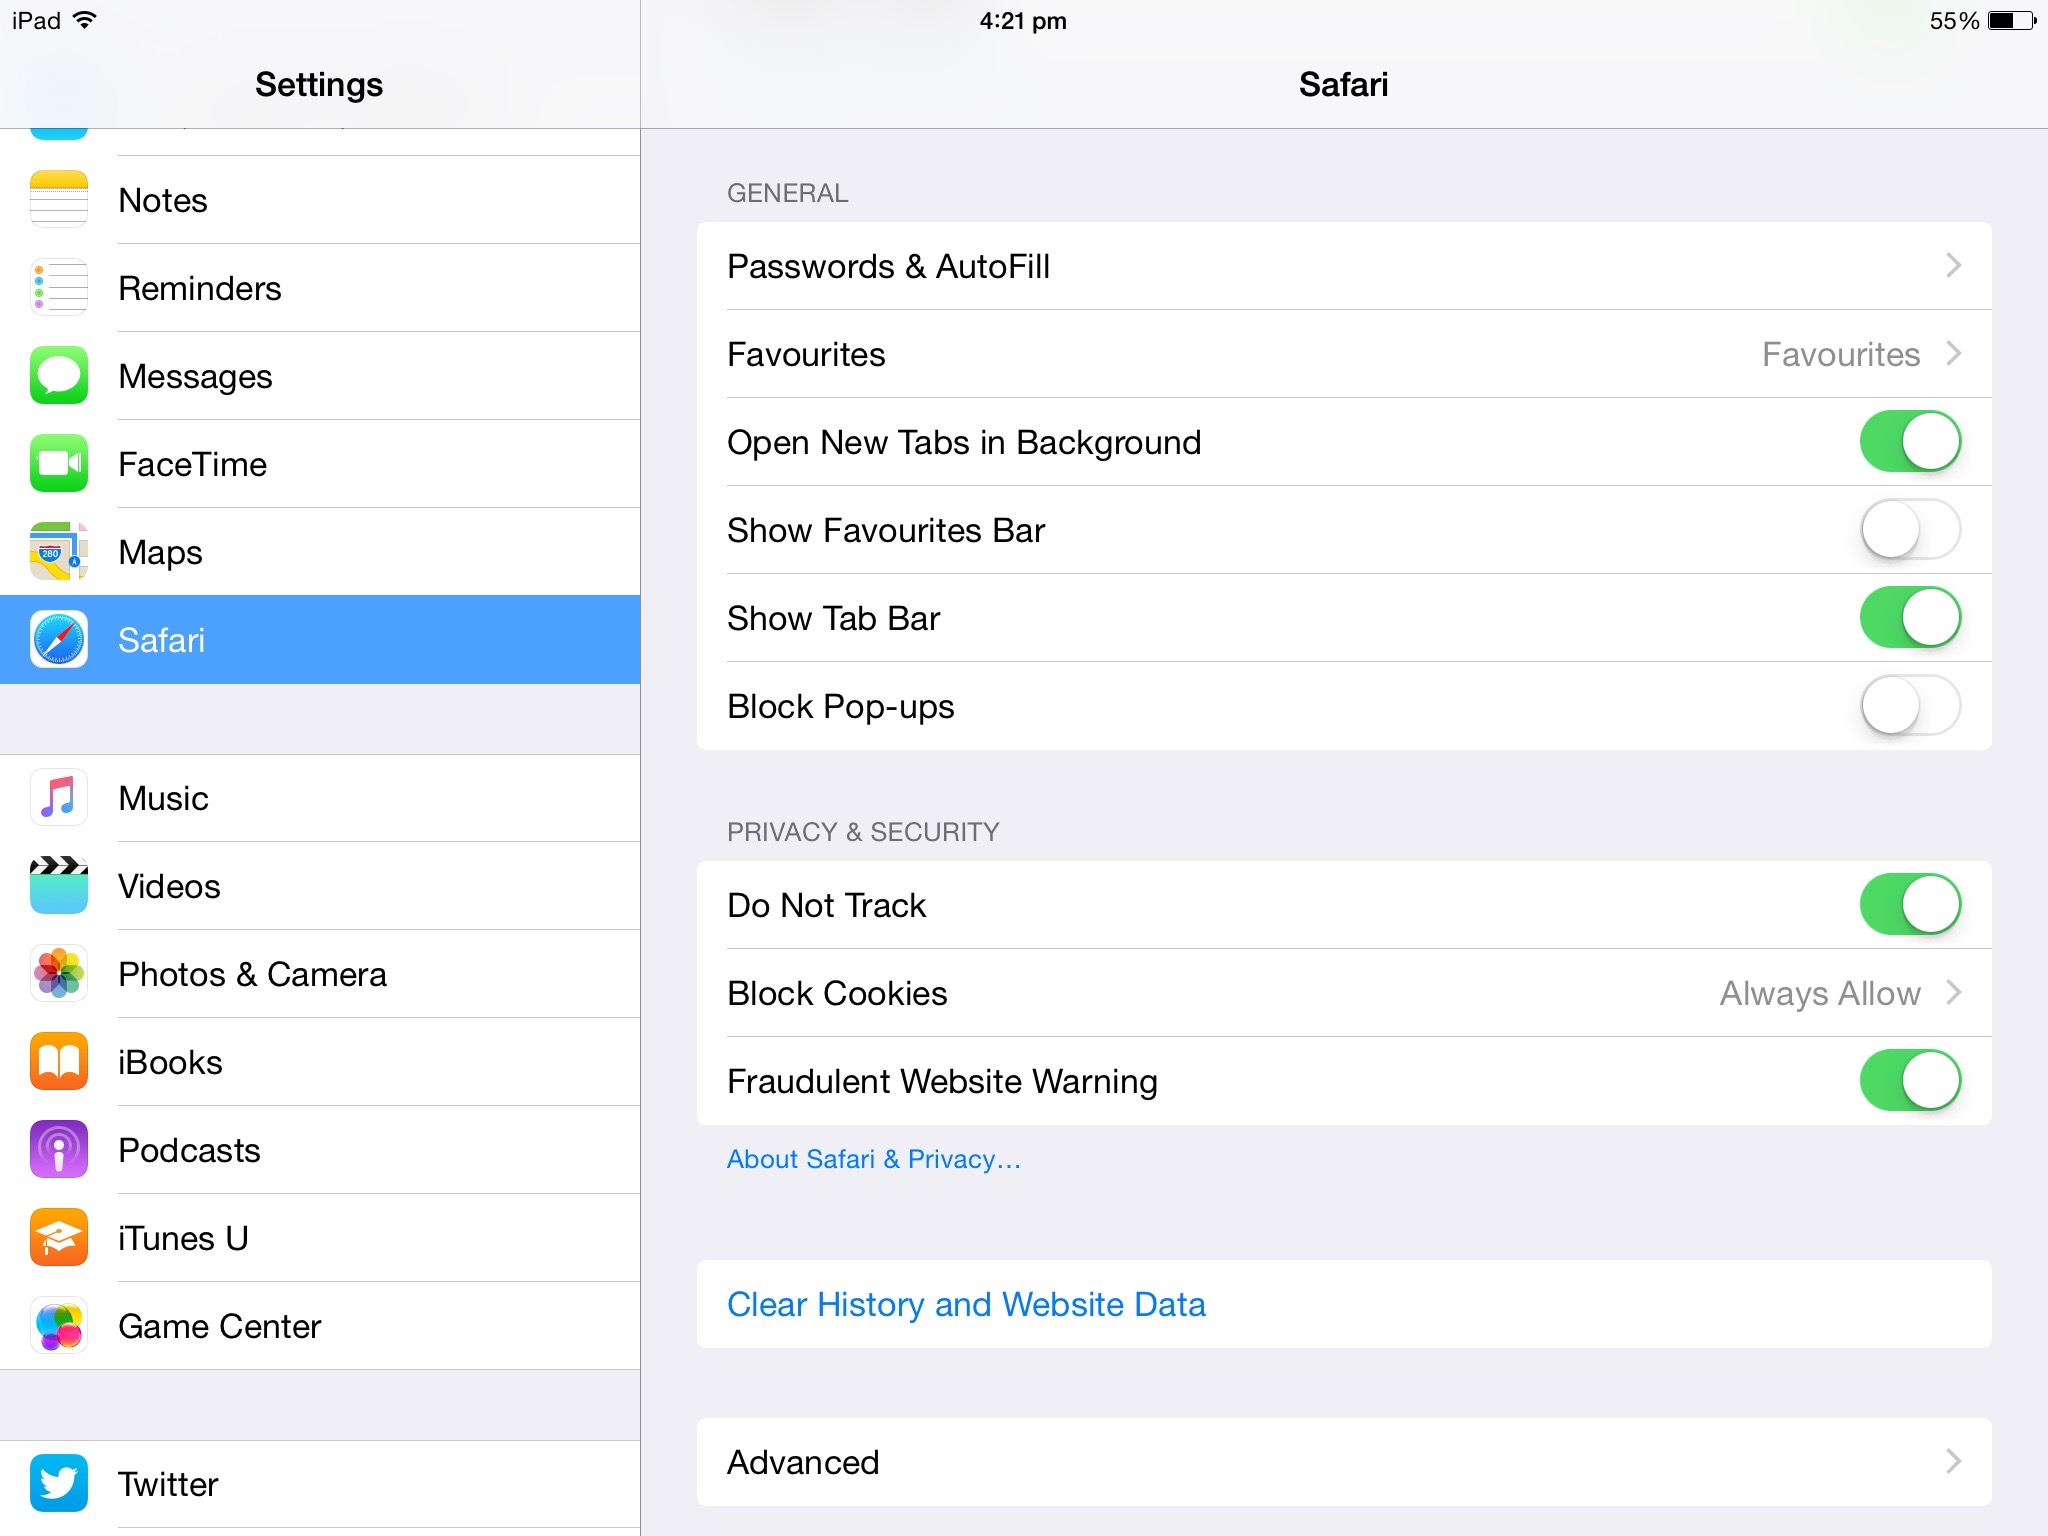
The popup blocker annoyed me, so I went to the Settings for the iPad and searched for the options for Safari. Sure enough there was a Block Pop-ups option:

There it is - Block Popus
I switched OFF this option, as shown here

With this set duly to OFF I tried launching the content again. I expected the file to open, but no, there was a further surprise. Now I was presented with a dialog box asking me to conform the popup.

A pleasant surprise
A pleasant surprise

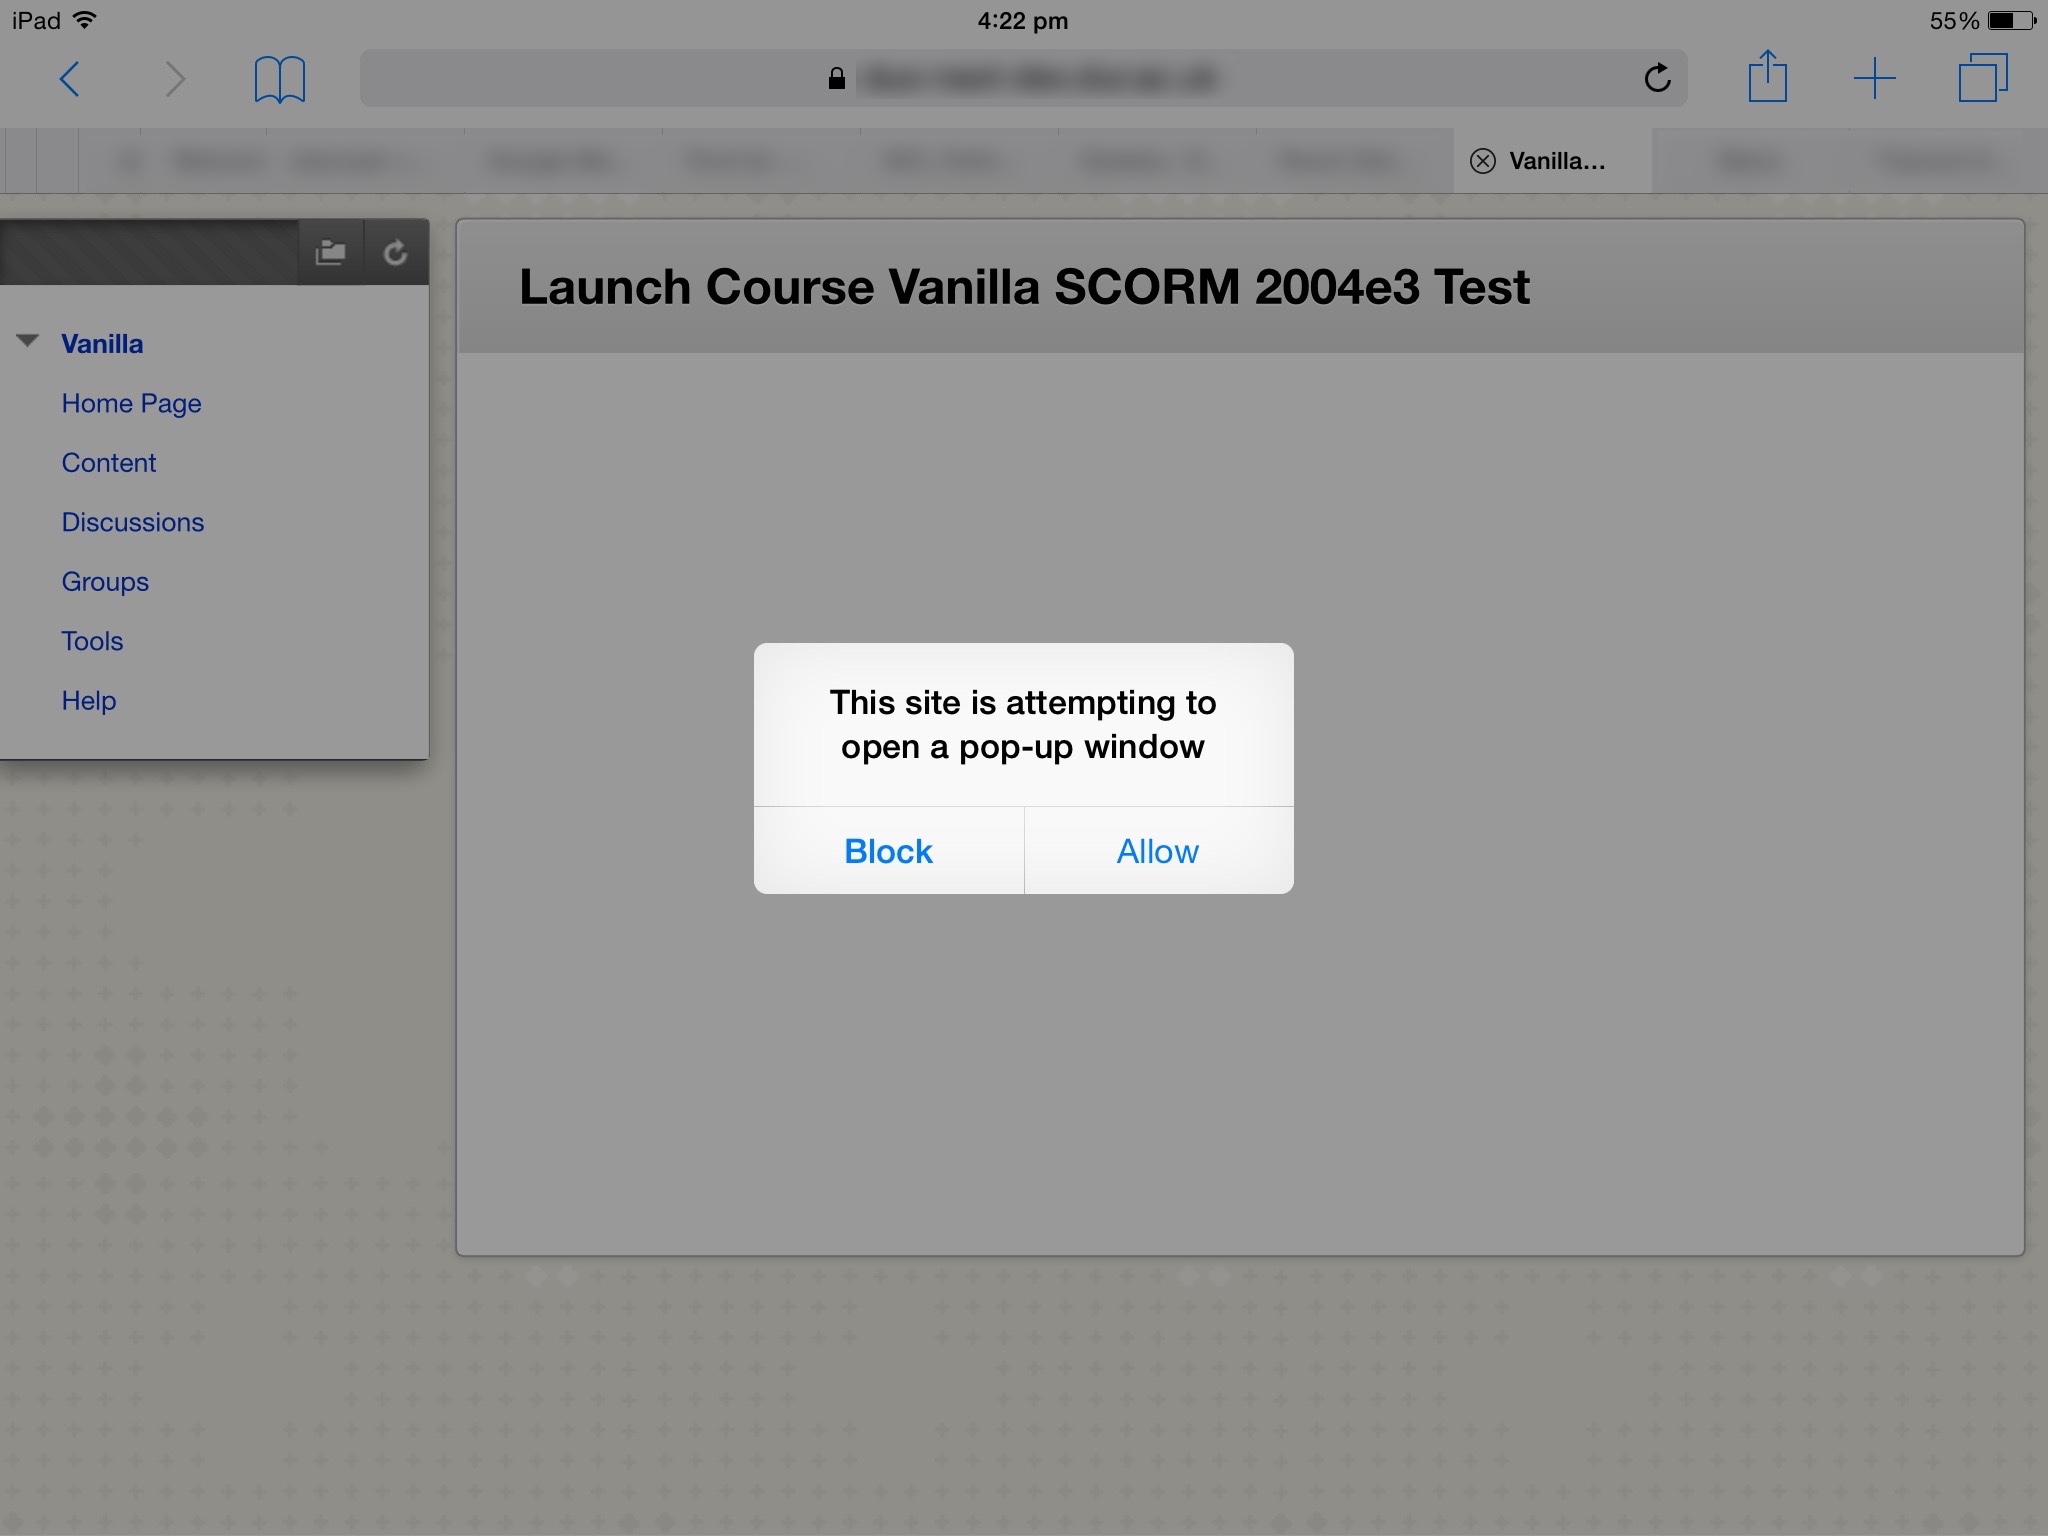
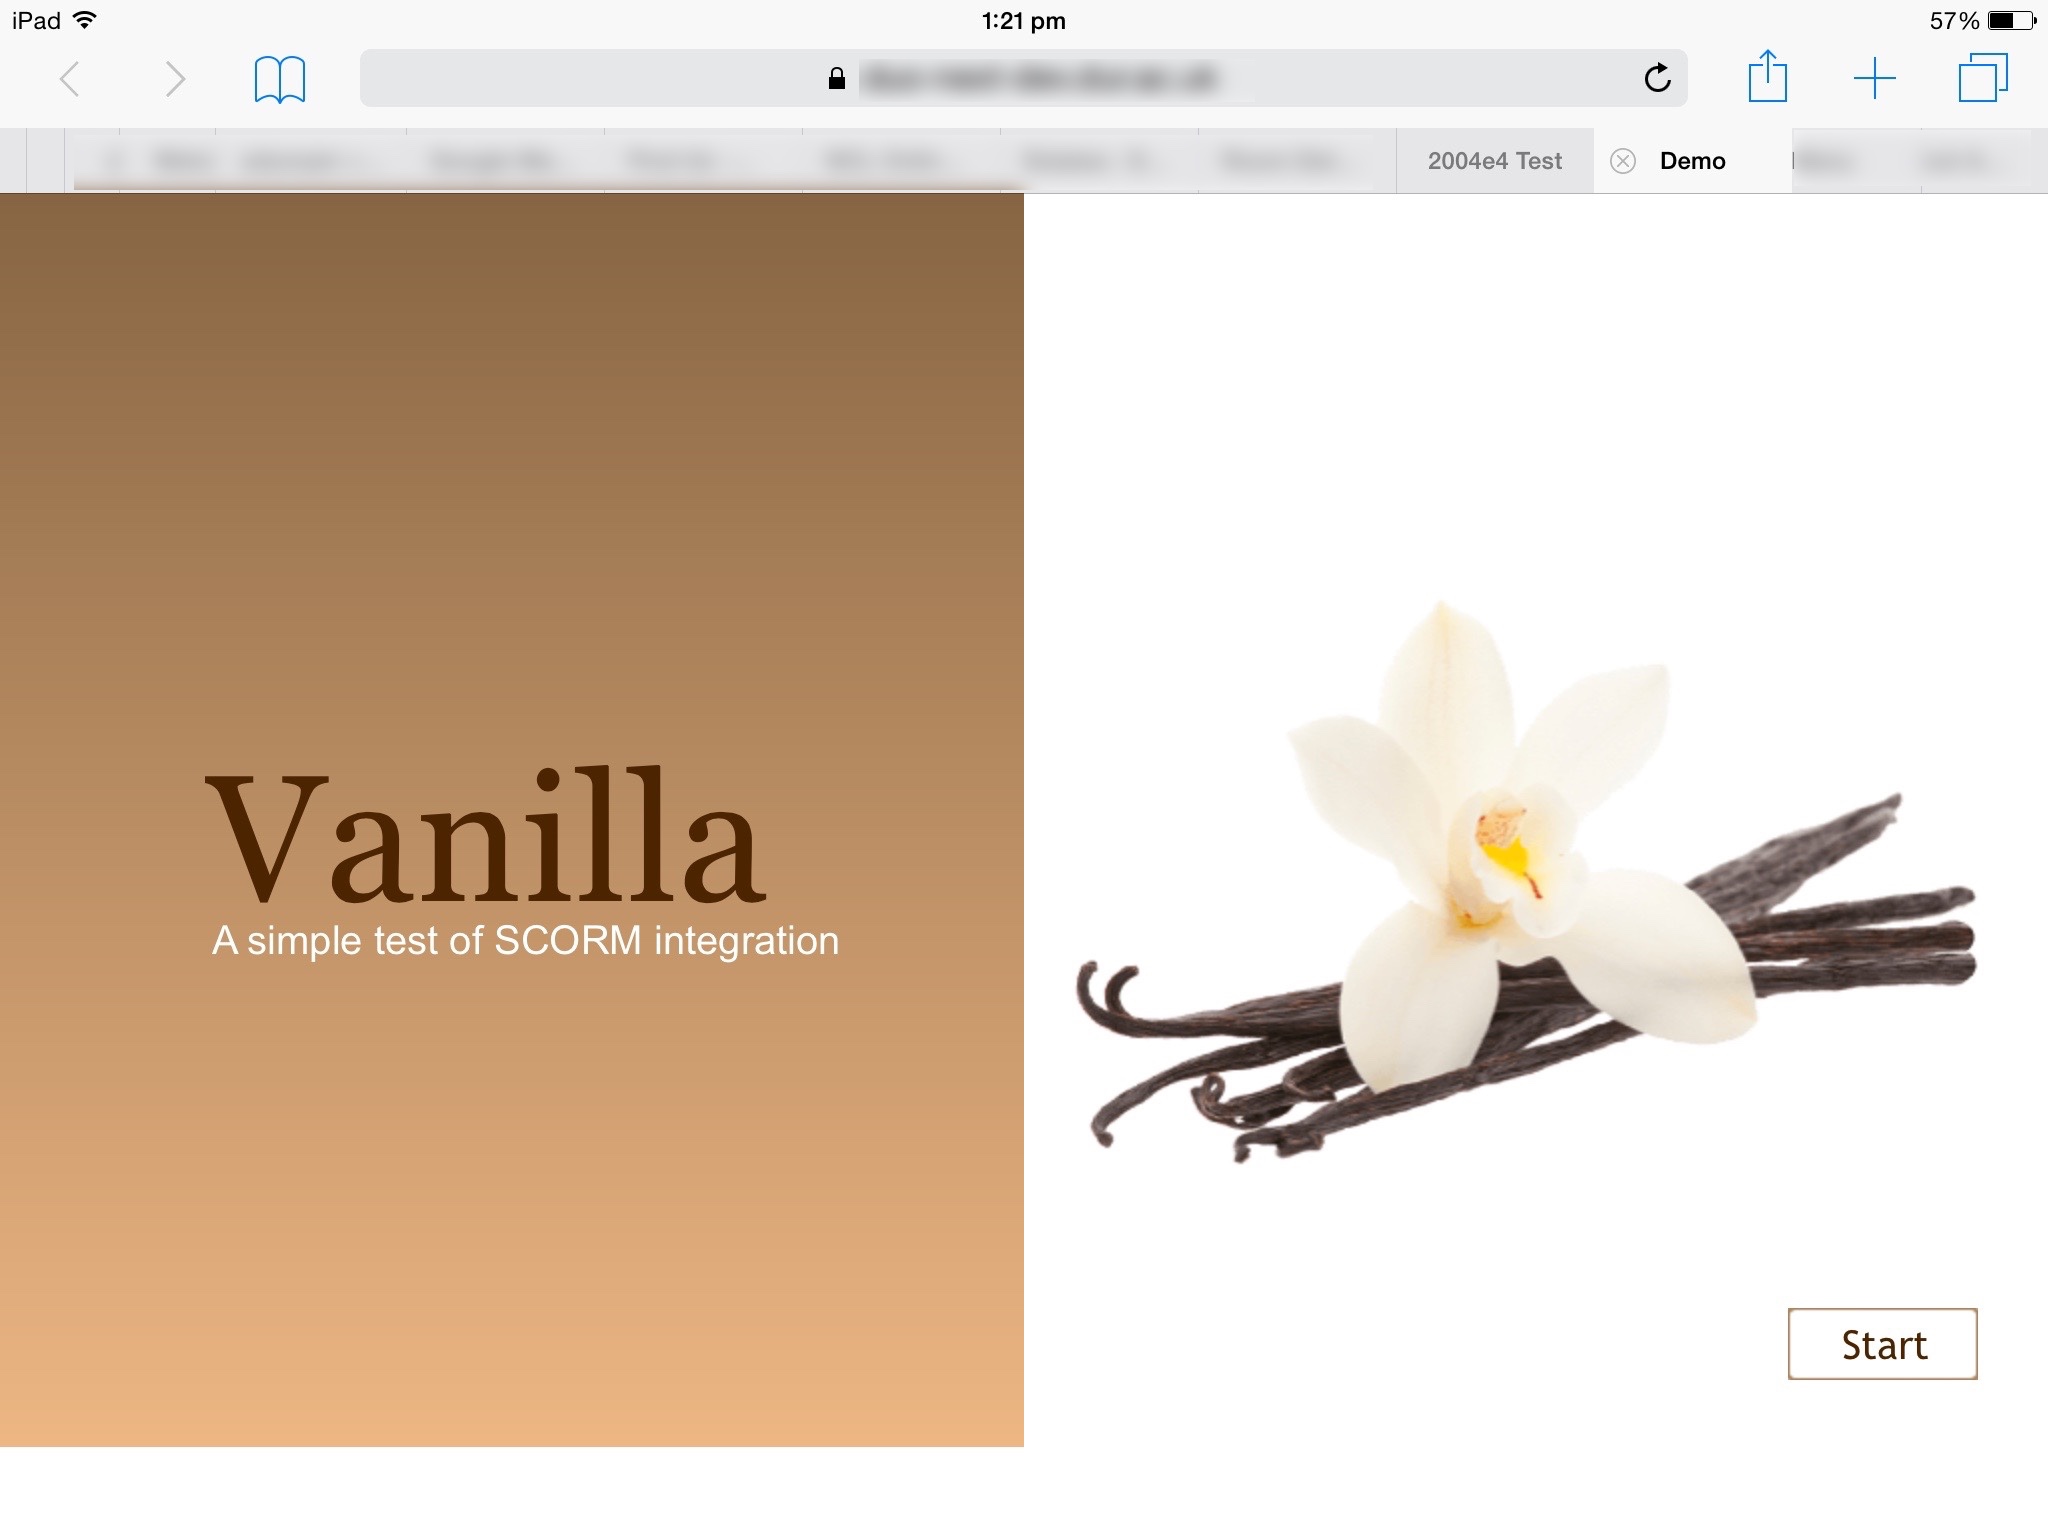
After clicking Allow the content launched as before, showing the same special Captivate mobile screen:

The icon at the top right opens guidance for using gestures


When the content is displayed, it is laid out respecting the orientation of the device:
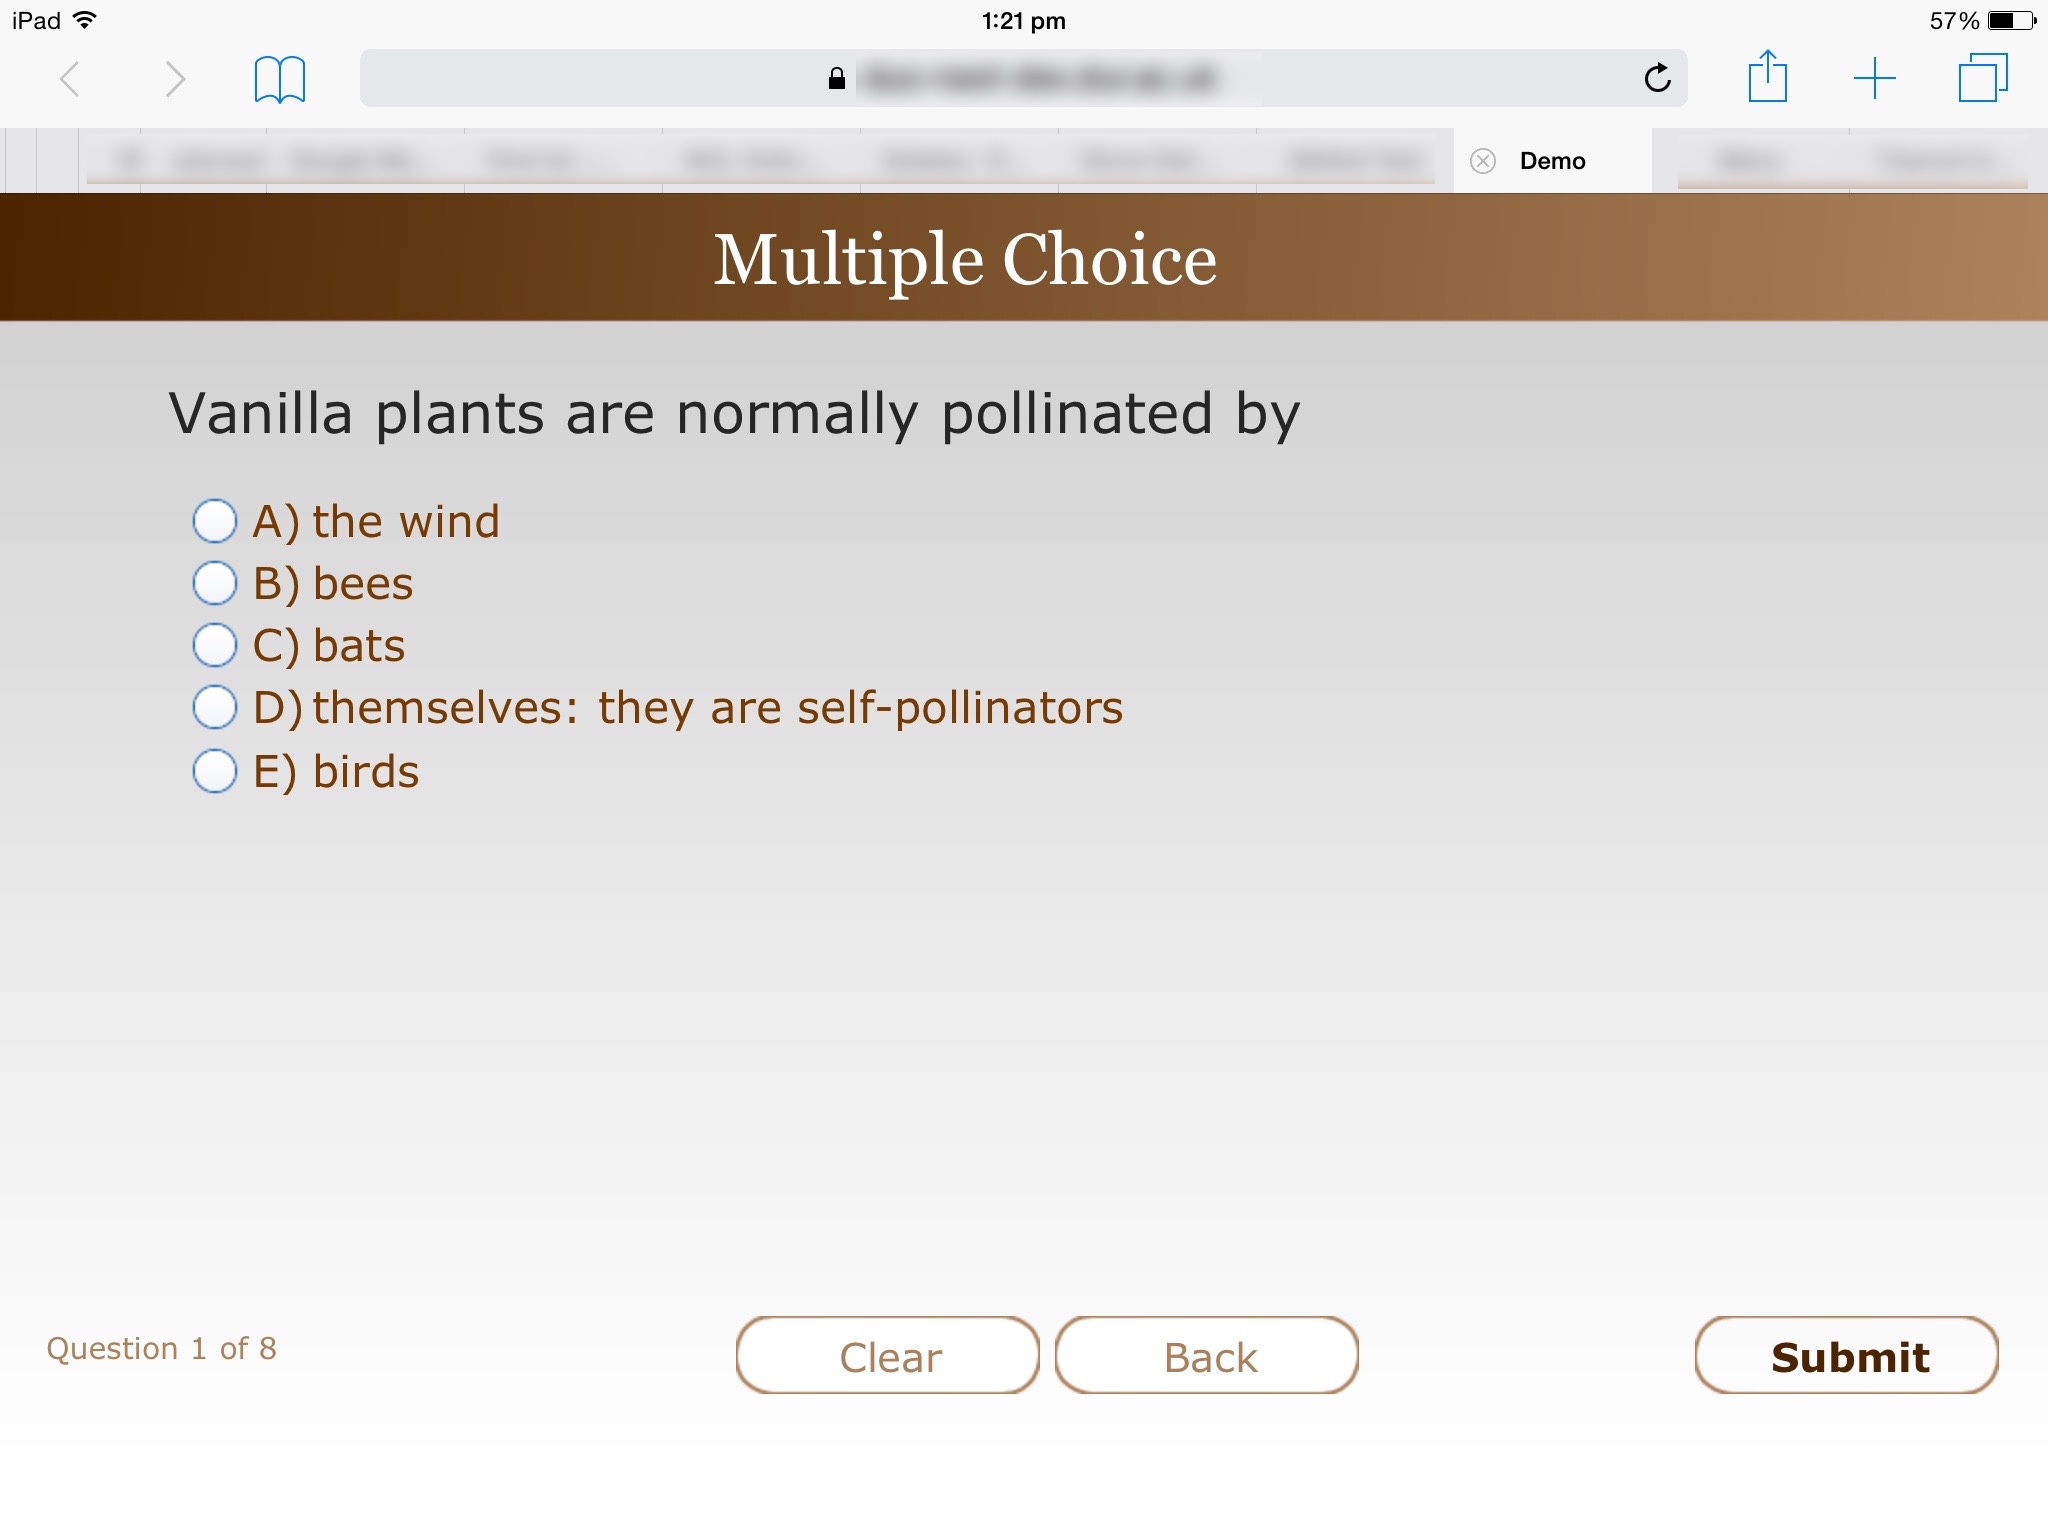
Landscape
Landscape

and if turned:

Portrait
Portrait – it has adapted to the narrower width, but not extended vertically.

Thus, with a bit of persistence, it is possible to play SCORM content using a browser on a tablet (or phone if you have a very high resolution screen and good eyesight).

Mobile App

The final tests used Blackboard’s Mobile Learn app.
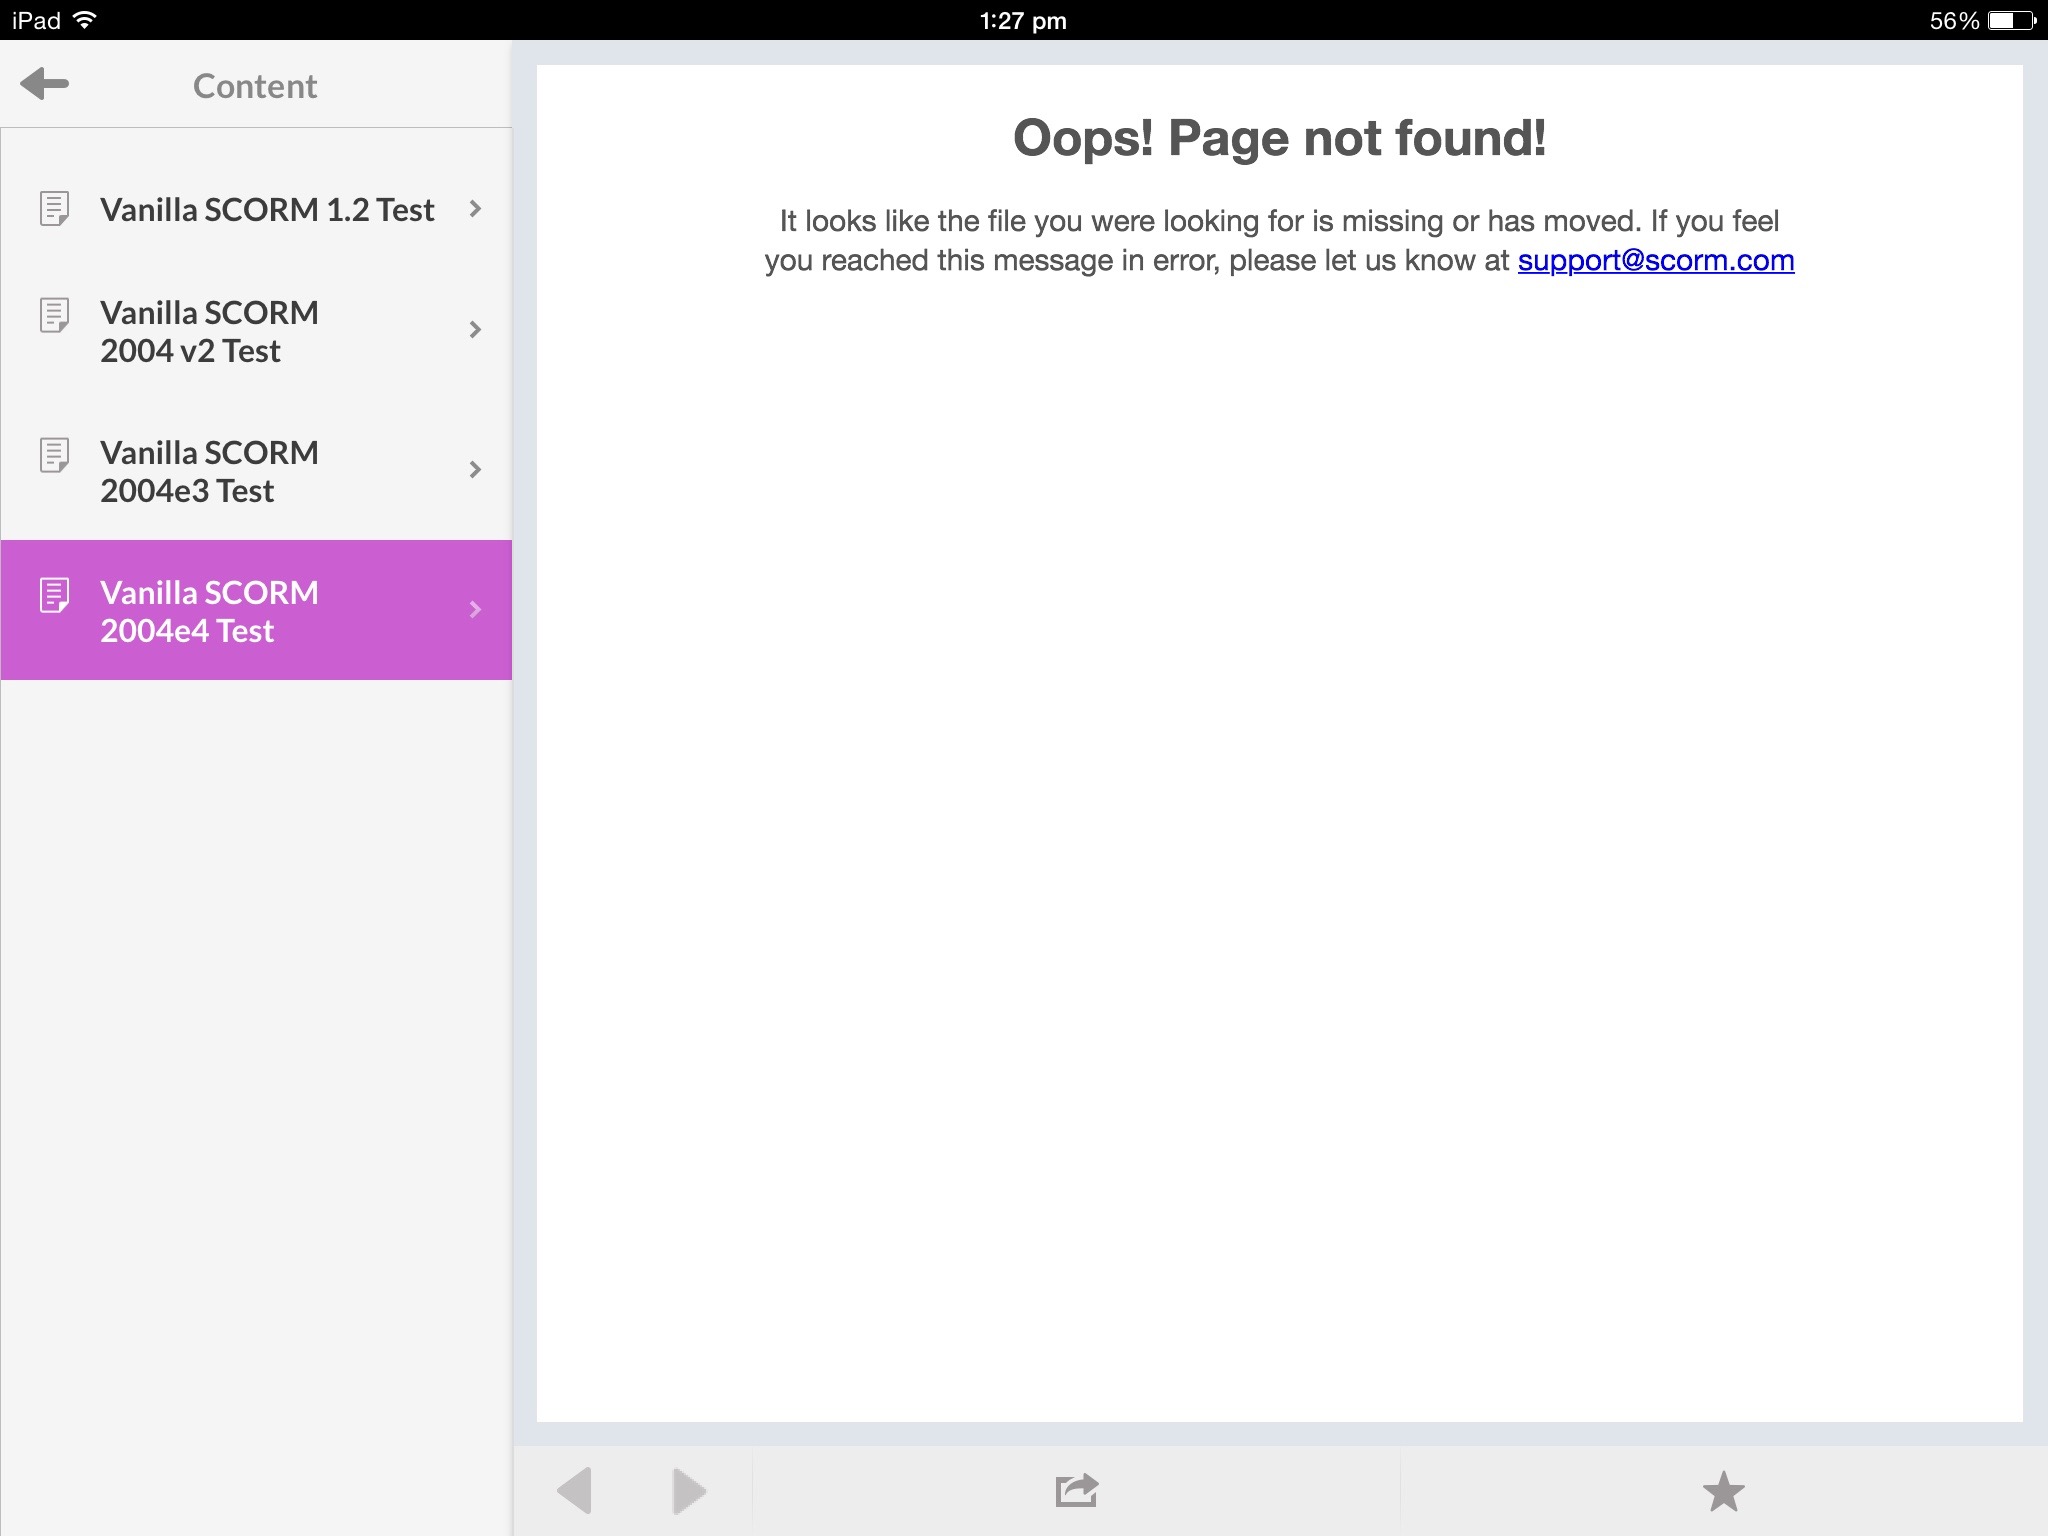
The content is accessed by navigating a series of nested menus:

Ah the joy of magenta

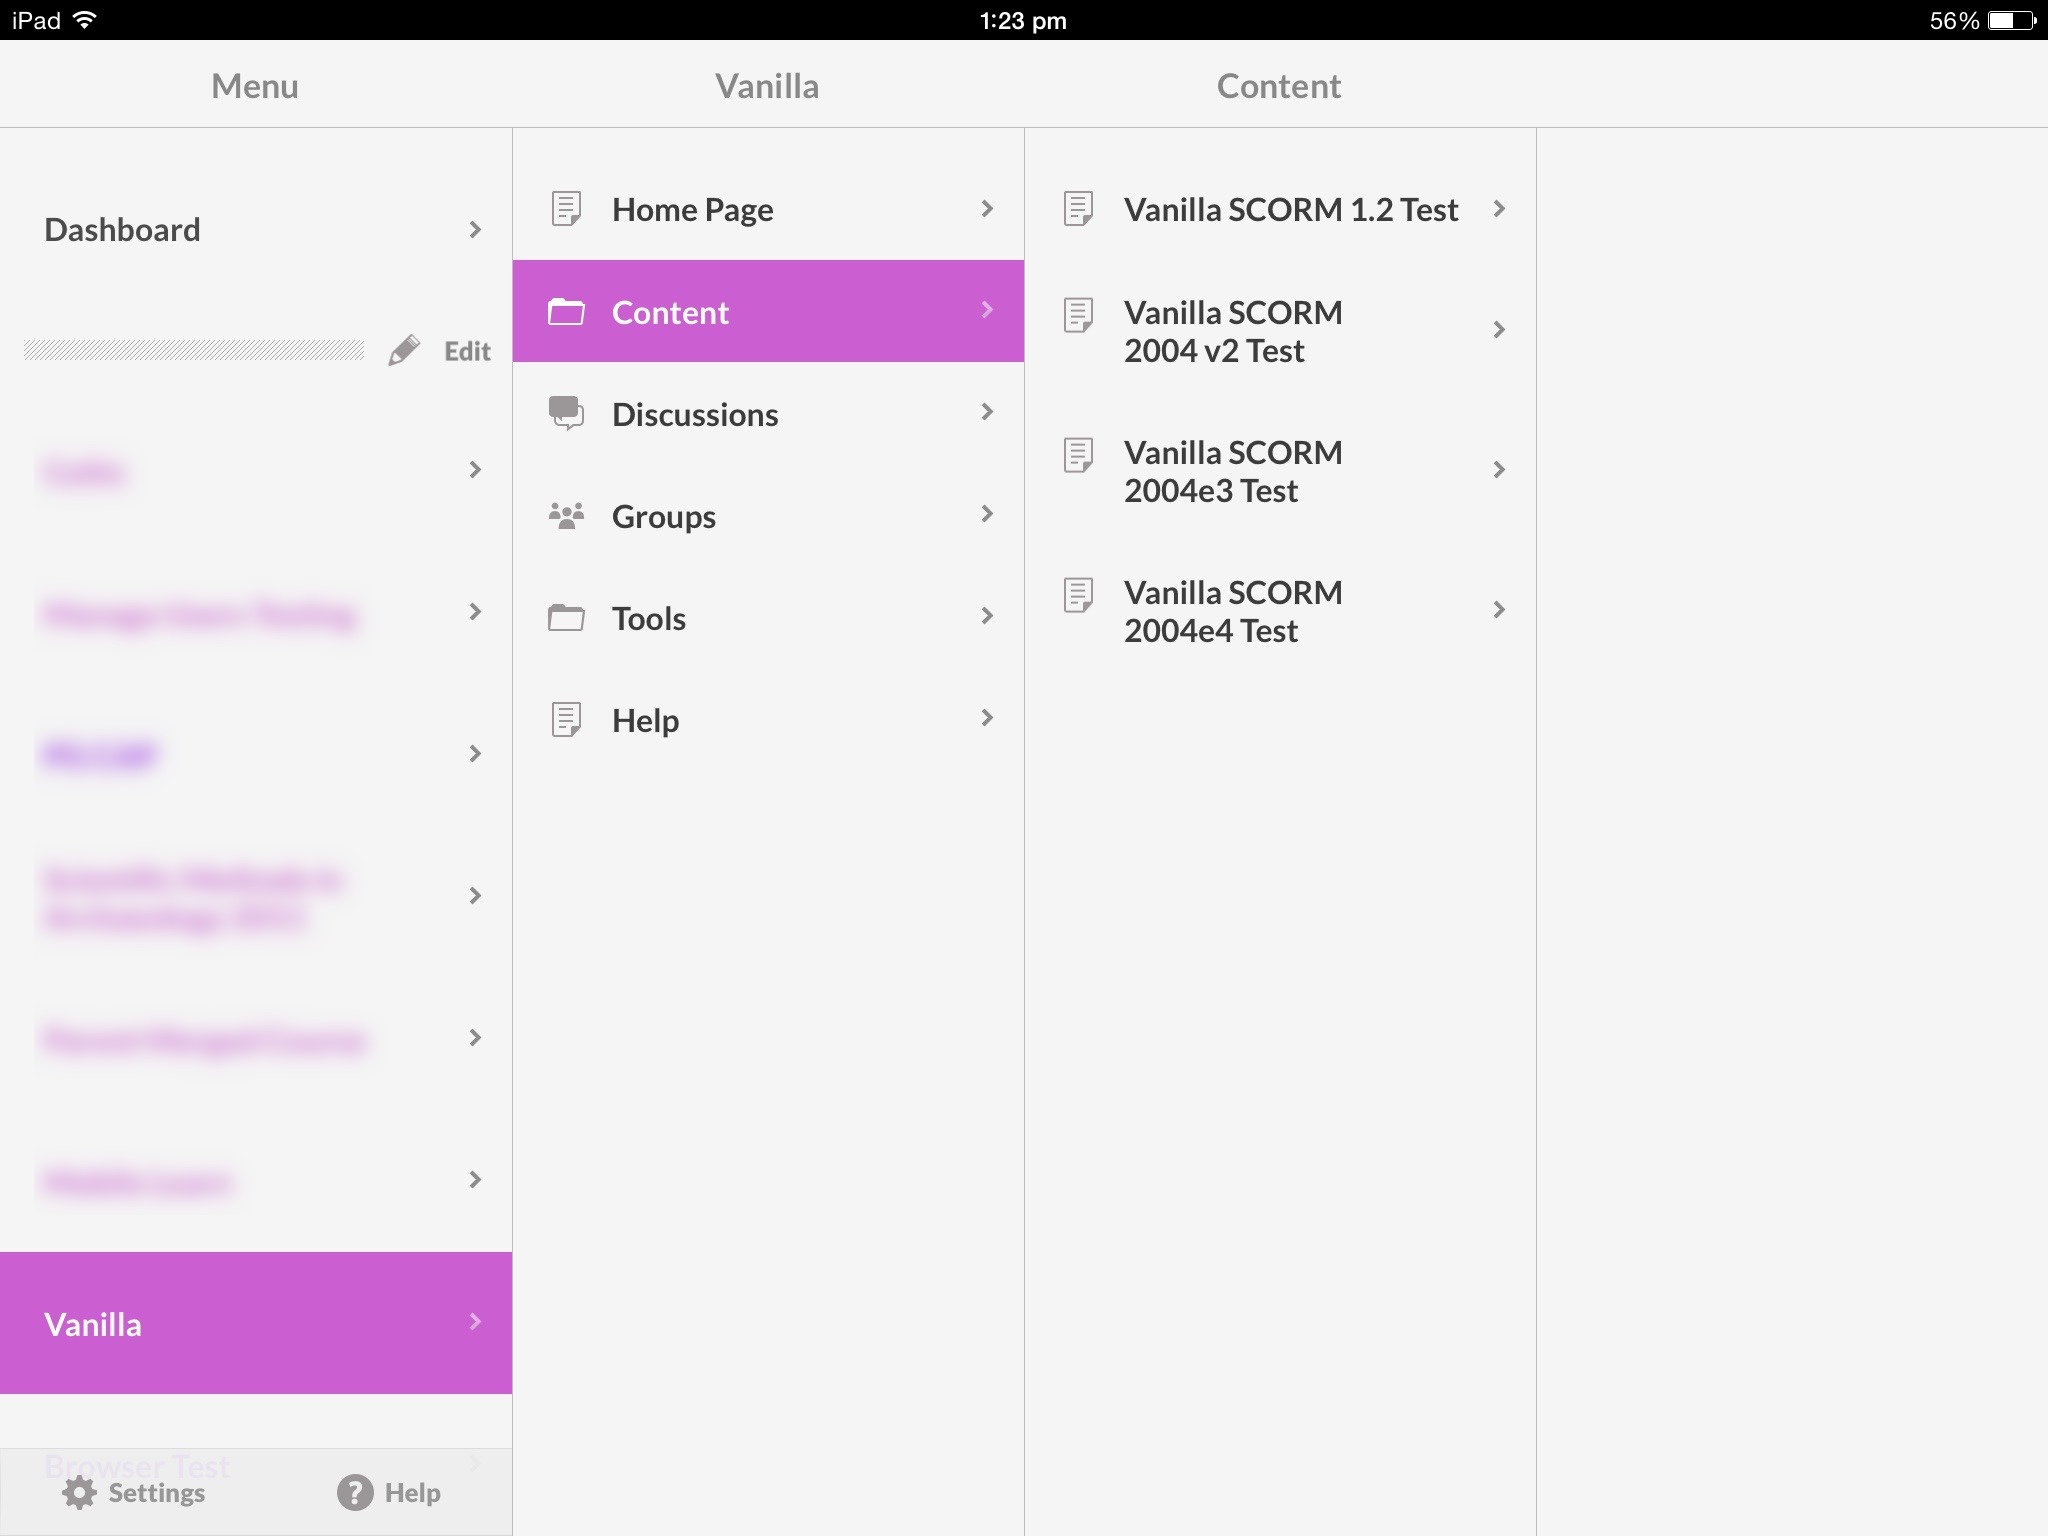
When you click on one of the links to the SCORM packages, the app does not know how to handle the content, so you are palmed off to the built in browser:

There's often quite a wait at this point...
There’s often quite a wait at this point…

but eventually you get this

Pop goes that weasel
A familiar page – note that this browser has ignored my Safari settings to allow Pop-Ups

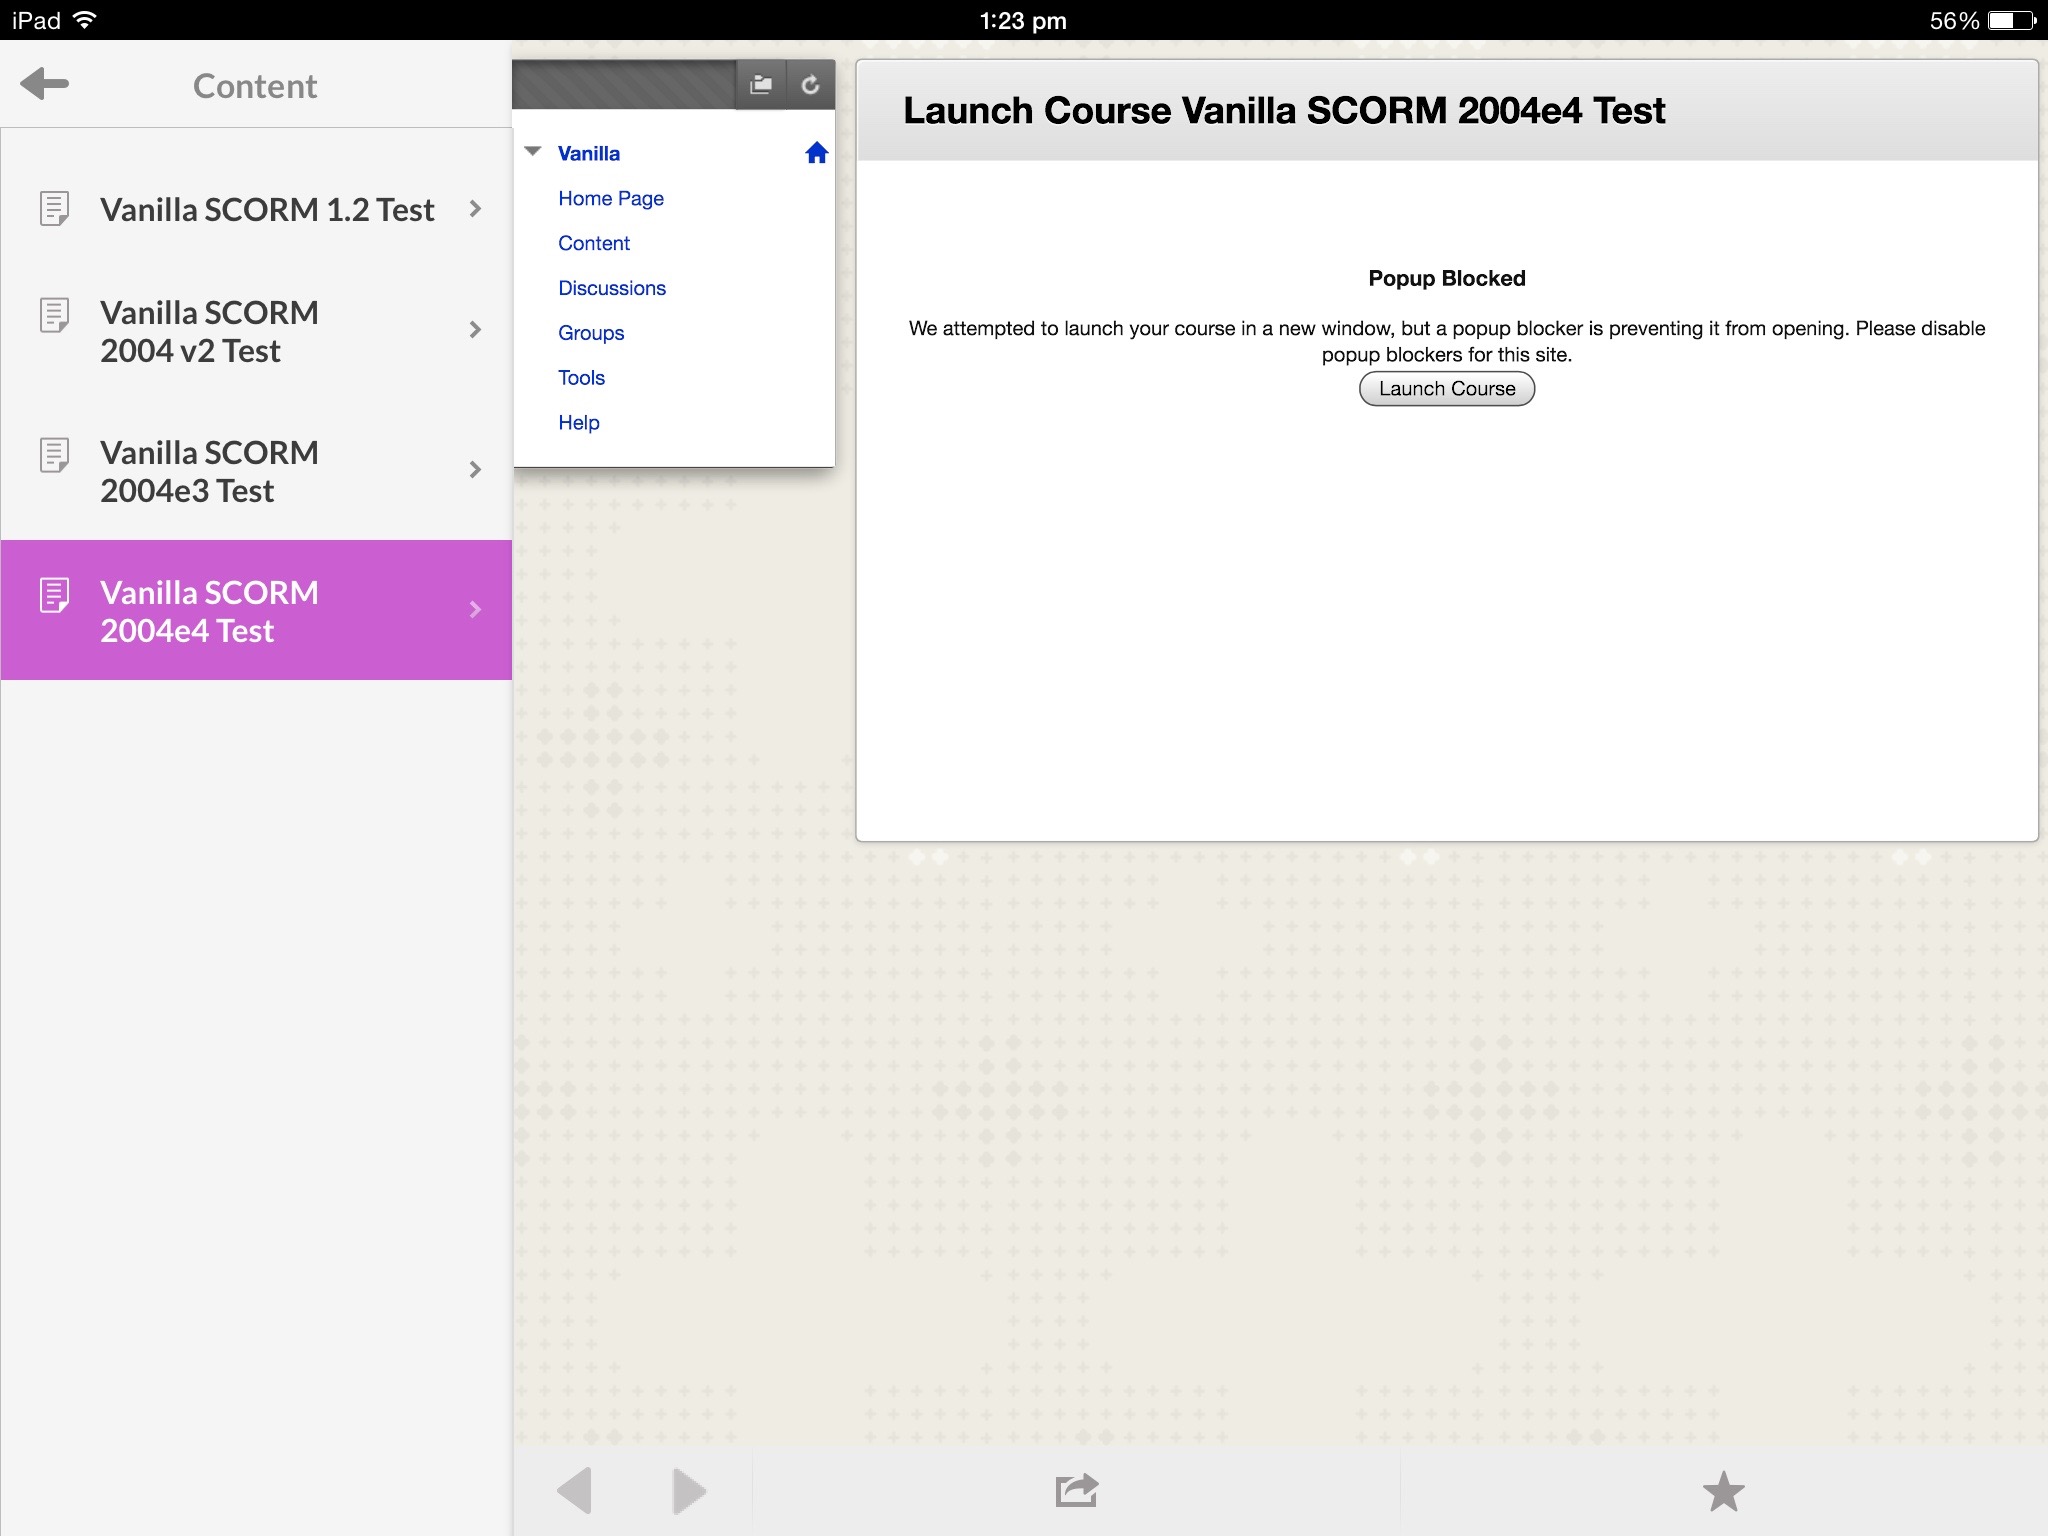
If I click the Launch Content button the result is again, not what I expected:

What
It seems the built in browser essentially closes the content on load, and so your SCORM session terminates abruptly.

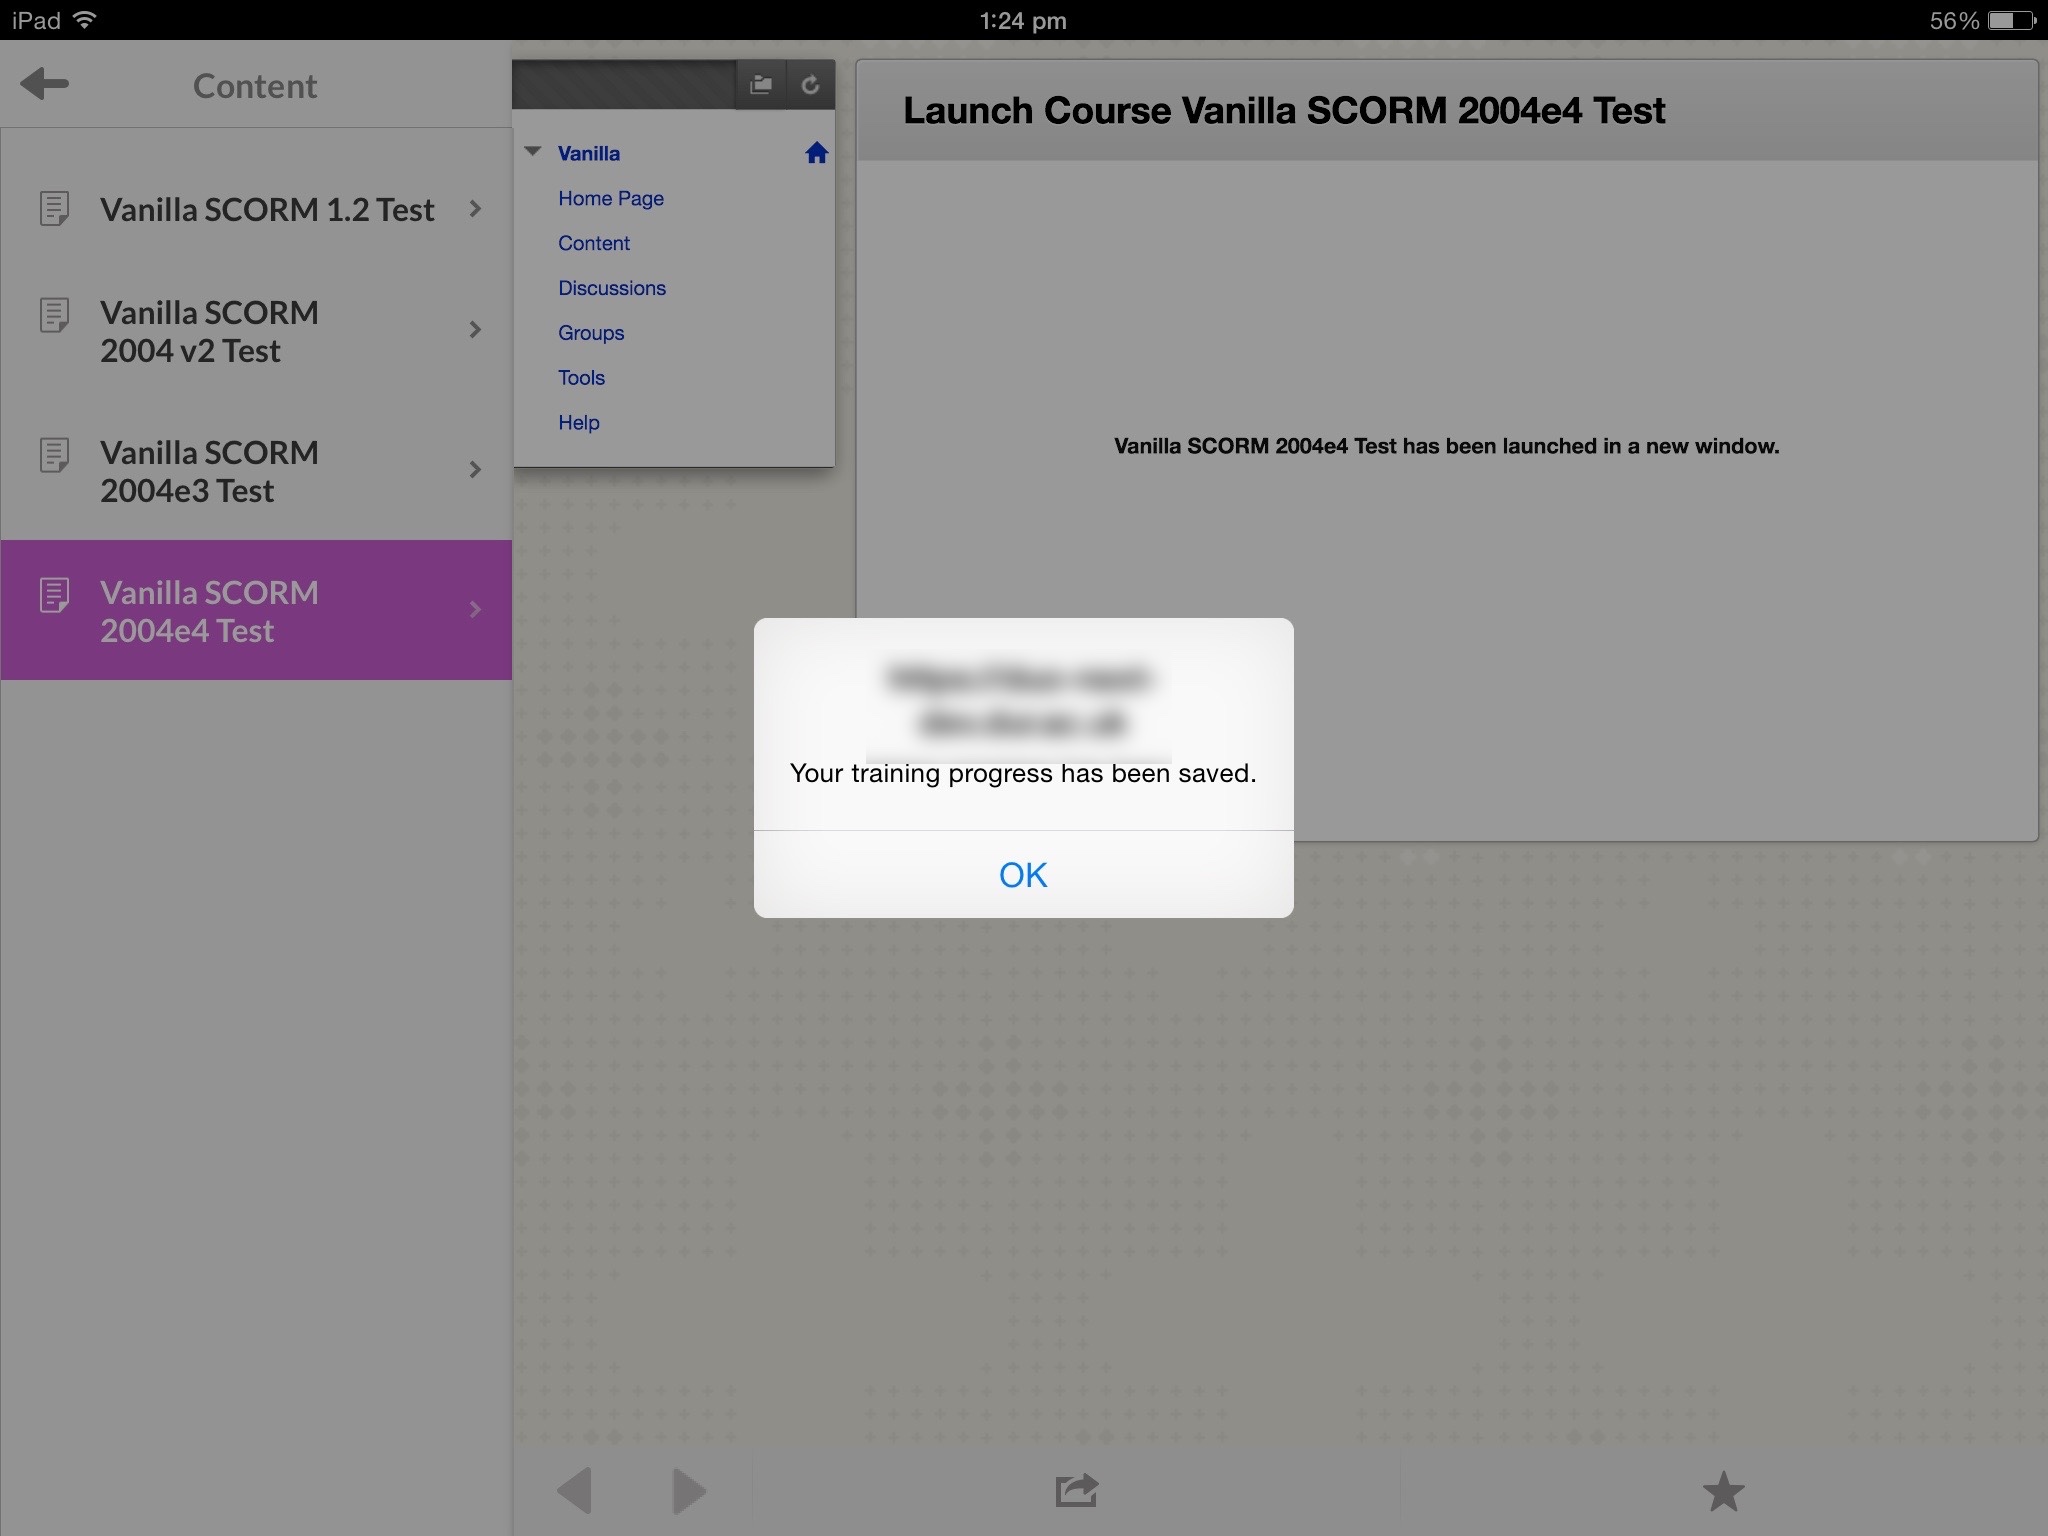
If you repeat this cycle and click fast enough, you can end up at this page:

Would they really want an email from me?

I also tried updating the launch settings in Blackboard to do everything I could to avoid the popup:

No joy
No joy

Result: still no luck with the Mobile App.

As such I have to flag SCORM content as incompatible with Blackboard’s Mobile Learn app at present.

Advertisement

What was (and wasn’t) said in Vegas

BbWorld was different this year, the second with Jay Bhatt at the helm.  This was most obvious during the main keynote/road map presentation. Gone was the rapid pace, regular clapping, the “cult of Chasen”, Bhatt was noticeably lower key, with some of the audience left waiting for some “killer” new announcement that never came. Indeed, some people who should have known better tweeted that the keynote was simply announcing a repackaging of nothing new. Bhatt undersold himself.

The keynote hid several major changes amongst a wide-ranging discussion about modern society, it’s ills and why the current education system won’t fix it. Needless to say this was delivered though the spectacles of technological-determinism and left me and many other members of the audience feeling a little edgy.

Moving on to the hidden changes, the first was a rebuilding of Blackboard’s wide range of products into a series of bundles. These will differ slightly for the K12, Higher Education and possibly the professional education markets. From my hurried notes during the conference these are:

  • Learning Core – essentially Learn plus the Community System, Content System (including xpLor and portfolios) the social/cloud tools and some form of mobile access.
  • Learning  Essentials – adds Collaborate and possibly some more features from Outcomes
  • Learning Insight – adds Analytics for Learn and also Outcomes for Assessment
  • Learning Insight and Student Retention – not the most imaginative name, nor the clearest definition, this seems to add some extra student retention features to complete the bundle.

More details are available Blackboard’s website.

Why is this important? Well Blackboard has just raised the base offering, essentially when this is rolled out, everyone will have at least the traditional academic suite (the ‘deathly hallows’ of learn, community and content). This should make it easier for the company to support the product (effectively by giving the product catalogue a long overdue haircut) but also much easier for users – the help documentation will finally apply to all users and we can get rid of questions such as ‘do I need the community/portal part for this to work?‘ It should also make user experiences more shareable and transferable. Anything that removes divisions between the user community is a good thing.

Secondly, a new user interface was demonstrated. This was a working prototype, accessing a standard learn database (if such a thing truly exists!) but using node.js to render much of the page content client-side. This makes the interface appear much more responsive and allows Blackboard to match the end-user rendering speed of other solutions such as Canvas. By shifting much of the processing work onto the client side, it also helps the core Blackboard product to become more scalable. The use of client-side just in time rendering also offers the possibility for much better reporting/learning analytics. A problem with building web pages in server memory and then sending them out to the end user is that you never know whether they saw the bottom of the page (or even the middle of a long page). If it is rendered on demand – e.g. in response to the user scrolling down – then we can record the fact that the information was at least actually displayed on screen to a person! In conversations I had with Stephanie Weeks she confirmed that this fact had not been lost on Blackboard either.

This is one of several signs that Blackboard may finally be able to lever their market dominance and vast range of products for the better. Hidden in the programme was a ‘State of the Union’ address by SVP Gary Laing. He began by sharing rather too much of his life story and desire to work with Blackboard to reimagine (re-engineer?) education, but then thankfully he talked about key changes that are occurring behind the scenes. Coming in to the company with fresh eyes he has seen the results of Blackboard’s aggressive takeover and merger approach: multiple product lines, often with a degree of overlap, running on different hardware, often based in different parts of the world, written in different languages by individuals in different teams, often with their own definitions of what should be common terms defined (and hopefully stored) only once – users, departments/schools, institutional roles, term dates, etc. Laing showed us how these teams and products should be rearranged so that features like analytics and mobile feel built in rather than bolted on. He challenged us to think about SMAC – social, mobile, analytics and cloud (note this could be re-arranged as SCAM). These are ideas he wants us all to bring back to our home institutions.

Then, a third Blackboard hosting was offered – as well as self-hosted and Blackboard’s current managed-hosting, there is to be a third multi-tenant option currently referred to as a public cloud solution. This looks like an attempt to play catch-up and stem the loss of clients with limited budgets to cheaper cloud-only solutions (particularly Canvas). It is unclear how building blocks will fit into this model and how much freedom individual clients will have to select or write their own.

Indeed there is much still to work out. What will the new pricing structure look like? How will building blocks be able to exploit the new Ajax user interface?  How many clouds can Blackboard manage? There were also some noticeable omissions – both the community and content systems were effectively ignored during the conference. Have they a place on the roadmap?

I think there are many reasons for hope from BbWorld14 and much for both Blackboard and the staff and student users to learn. It was great to see so many students present at the sessions and as ever, their choice of external keynote speakers was excellent. As for number 15, to be held in Washington DC, if they can reintroduce the client voice back into the programme selection, to allow it to become more critical (in a constructive way) then I am cautiously optimistic for the future.  At least they late realised that dropping the developer conference was a mistake 🙂

I’d like to end this review with a challenge for Jay Bhatt and his colleagues at Blackboard. If he really wants to reimagine education and believes that the way to do this is through data-based decisions, then is he willing to move Analytics for Learn into the entry level Learning Core bundle? Giving every Blackboard  user across the world access to powerful, integrated learning analytical tools would be a very strong message. Creating a common platform and millions of users would give the field of learning analytics a real boost, by allowing staff and students to easily exchange interesting questions and patterns. That might just get the slogan off the t-shirts and into our daily teaching and learning…


Canvassing Opinion

I spent today in Edinburgh at a presentation about Canvas – a VLE by the strangely named company Instructure (it doesn’t exactly roll off the tongue). To declare a potential interest, I currently work for an institution that has a long history with a competitor – Blackboard. I leave it to the reader to decide whether/how that colours my comments.

A large part of the day was spent listening to staff not sales people – Darren Marsh and Margaret Donnison from Birmingham University which has recently been through the periodic VLE review process that every educational institution undergoes from time to time. In Birmingham’s case, their current VLE (WebCT) had gone ‘end of life’ and so they were facing a migration regardless of which product they chose. In that sense it is an excellent example of an unbiased evaluation, as there was no status quo option. On the down side, WebCT is pretty long in the tooth and would fare poorly in a comparison with almost any VLE on the market today.

As well as the need to find a new VLE system, the University felt that distance and blended learning was becoming more important and that the market was  undergoing a period of disruption due to factors such as increased student fees, MOOCs and alternate modes of delivery. Their needs were clearly expressed in a few points:

  • a high quality product
  • fit for purpose
  • distinctive

That last point is interesting – in a market dominated by a small number of vendors, is there a risk that all institutional offerings look the same? This is an intriguing proposition that I have some issues with – is the online learning experience only skin deep? Equally does just changing the appearance of content (akin to applying a different template to a WordPress site) significantly alter the learner’s experience in any meaningful way? That doesn’t fit with my experience. I think the MOOC I learnt most from so far was the #OCL4Ed course hosted on WikiEducator/MediaWiki. It looked awful and was hard to navigate, but the learning activities were well-designed and stimulated meaningful collaboration amongst the participants (e.g. commenting on each other’s blogs – see http://apperleyrd.wordpress.com/).

A question I didn’t think to ask at the time was where had this notion of distinctiveness come from? Was it requested by academics, tired of working in the same old online courses, was it from students, or perhaps from marketing? I have seen a lot of student feedback describing institutional VLEs as ‘clunky’ and ‘tired looking’ but I’ve never seen any students asking for them to be more distinctive!

The findings of Birmingham’s detailed tender process were echoed in the subsequent demonstration of the Canvas product – there is a large feature set common across all the major VLE platforms. We saw demonstrations of online marking using the cloud Crocodoc/Box View service, adaptive release of content based on dates and tests scores, integration with third party services such as Kaltura, Panopto, YouTube. Whilst slick, these features should have been familiar to the audience and many required the purchase of third party services (e.g Kaltura and Panopto). Assignment workflow was a little disappointing, lagging behind that in Moodle or Blackboard – no support for moderated marking, anonymity and other factors held dear (even if perhaps in some cases misguidedly) by many UK HEIs.

Great play was made of the ability to use the IMS LTI standard to connect to third party systems. They publish an impressive catalogue of possible integrations at http://www.edu-apps.org/index.html. A closer inspection shows that very few of these services have been certified as compliant by IMS (see http://developers.imsglobal.org/catalog.html), which makes me wonder whether they take advantage of the full range of LTI features (e.g. populating the grade centre) or are just a simple launch point that may or may not actually implement LTI.  Later I browsed through a few entries on edu-apps and some of the comments about tools no longer working (including the YouTube integration) were a bit worrying – although in this case they might have just referred to integration via Moodle.

Also, although IMS are working at a standard for analytics data – caliper – this is not yet ready to implement, so integrations that rely on LTI will not provide any tracking/usage data to the parent VLE. This is a missed opportunity for both staff interested in their learners actions in a given course and those trying to aggregate data across courses, or attempting to measure the return on investment in a particular tool.

Interesting too that like many other VLEs,  the ability to integrate with 3rd party systems using LTI first requires action by a user with appropriate privileges (see http://www.edu-apps.org/tutorials.html). Whilst the document suggests this can be done at a course level, in practice I think this may be restricted to system administrators –  if only  to keep the lawyers happy and to safeguard the privacy of our users – creating a potential bottleneck to innovation.

Canvas offered a distinctive hierarchy of user accounts and sub-accounts (with permissions inherited) that allows you to model the University, breaking it down into faculties/colleges, then further into schools/departments, and assign branding, permissions, even custom javascript. This is interesting and something I plan to explore further. As ever the devil is in the detail and Universities seem to excel at complicating situations. For example should you divide it up by faculty, or level of study (e.g. separating undergraduate from postgraduate courses?) Should the mode of delivery matter – differentiating between face to face, blended and distance courses? I wonder if this user account model cope with several different overlapping possible hierarchies? Should these change in the future, how easy will it be to change this?

Although only just coming to the end of their first year of using Canvas, Birmingham had found the time to solicit student feedback via questionnaires. The usual caveats about small sample sizes, risk of only capturing the extremes of opinion and questionable use of some leading questions all apply. Still 84% of students agreed with the statement that they found canvas easy to use, and an encouraging 88% found it useful for their studies. Perhaps more worrying is why 12% did not, assuming that it contains links to the course materials, online tests and e-submission!

Common themes that the students praised were ease of use and a clean layout. Looking at Birmingham’s implementation (which provides a pretty standard canvas course) you can understand the ease of use – the interface is relatively uncluttered and the content is restricted to materials relevant to the courses they are taking. There was no evidence of any portal functionality being delivered through canvas – a later perusal of their website identified [my.bham] – a student portal based on SunGard’s Luminis product.

The clean layout is an interesting comment. I’m not sure if this means ‘it looks like Facebook/Wordpress’ and just reflects the widespread adoption of this user interface model, or whether it was very like the old WebCT course structure they already knew? Screenshots showed templates with similarly labelled folders on Canvas, some even going to the trouble of replication the icons representing folders in WebCT.  On a more positive note, it might be the result of carefully planned and structured courses on the new system.

One advantage of switching learning environments is that it offers the institution a chance to start again. It is all too easy for systems to become bloated over the years (like an old laptop) with content that is no longer used, courses based on copies of copies of copies, all of which can have a negative impact on performance. Also it provides staff with the chance to review the content and online components of their course. Doing this across a whole institution and with a real fixed deadline, where just using the same stuff as last year is not be an option, has benefits that can’t be achieved through an isolated course review (though I’m not arguing you should stop doing this either, there’s just an extra benefit/multiplier effect when everyone is thinking, talking and sharing about this at the same time). It’s also a good time to check all the links work, content is copyright cleared, etc.

It is also a good motivator to get staff to attend training. Birmingham use a mix of face to face workshops with online materials – with separate courses for staff and students.

As a relative newcomer to the market and built for a hosted, scalable solution from day 1, I was interested to see canvas performs on mobile and tablet devices. Sadly there was no evidence of responsive design comparing the experience in a standard browser at different screen sizes and on laptops and tablets 😦
Like many other vendors, they have released mobile apps for iOS and Android. I thought that the mobile UI they showed actually looked nicer than the standard one, with clear icons next to course menu buttons giving an extra clue to the functionality of the links . Special apps exist for dedicated tasks e.g. the SpeedGrader app for online Grading – which on a cursory inspection seems a bit like Turnitin’s GradeAnywhere app, though without support for offline marking of downloaded scripts.

This video shows Canvas deployed on a range of devices and footage of the custom SpeedGrader app:

A few eyebrows were raised around the room when they mentioned their approach to versioning/software release: there is only one version. They operate an agile approach with new releases every three weeks. When probed, there is a degree of control, it is possible to turn off or delay the implementation of new features on your build. This is good news if you want to avoid any changes during key times (e.g. online exams) but seems to contradict the one version policy and I am not sure how it works with their online help documentation – does it respect all these local settings?

The product is only available as a hosted service, sitting on the Amazon AWS cloud, providing a scalable solution, with a promise from Instructure (UK) of 99.9% uptime over a year – assuming it doesn’t fall foul of a denial of service attack by those angry about it’s approach to in-country taxation.  They use the Dublin-based AWS European Data Centre for EU clients to keep everyone happy. It is unclear whether all the bundled extras – e.g. the  Big Blue Button conferencing app – also offer an EU or  -Safe Harbor compliant solution.

Although Canvas’ origin lies with American computer science  students dissatisfied with their current online experience (sound familiar?) the staff present in Edinburgh were keen to play the international card. It was good to hear them supporting localisation for different languages (no support for Gaelic yet) and with research and development teams available in-country – in the case of the UK in London. As one of the small fishes in a pond still dominated by the US, it is always nice to know that someone is listening and able to act locally.

Although we ran out of time, they are also analytics options and Instructure staff were  keen to hear from UK institutions wanting to use their Canvas network product to facilitate MOOCs (like #BlendKit2014).

More information about Birmingham’s experience can be found on the UK Canvas site  (though tred carefully as the comparison table Canvas publish doesn’t give me much confidence in their QA – I found errors in the third row: Development Technology). They also link to this video, note it was uploaded to YouTube by Canvas, not Birmingham:

Some final thoughts:

Q. Did the day leave me feeling that our current platform (Blackboard) was pedestrian or had been eclipsed?
A. No – some features in Canvas look slicker/more mature/better than Blackboard, but equally some  features in Blackboard look slicker/ more mature/better than Canvas.

Q. If I was looking to implement a VLE from scratch or undergo a review of provision would Canvas be on my short list?
A. Yes.


by Featured Image iVincent by JD Hancock shared on http://photos.jdhancock.com/photo/2014-02-22-200113-ivincent.html